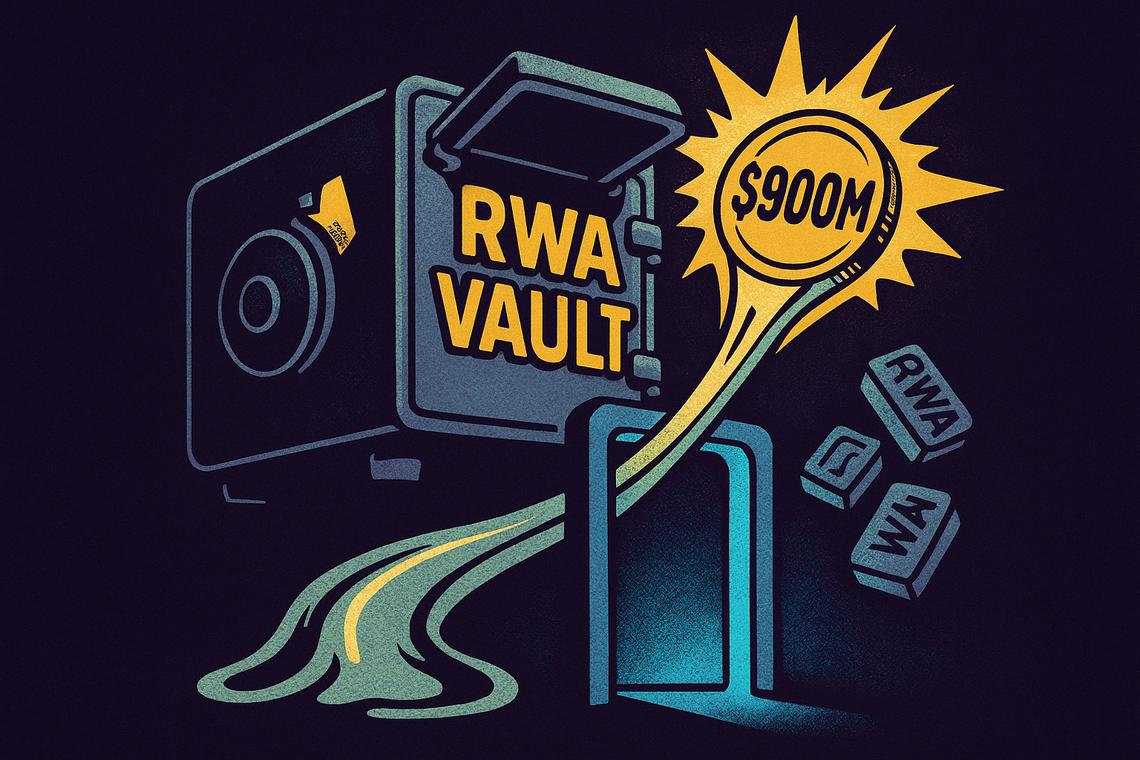
Something interesting is happening in the race to tokenize real-world assets on blockchain networks — and Solana is pulling ahead faster than most expected. The Solana RWA market just recorded over $900 million in net inflows in a single 30-day window, according to data from RWA.xyz, placing the Layer 1 network at the top of the leaderboard among major blockchain platforms. That’s not a marginal lead. It’s a structural statement about where institutional and developer appetite is concentrating right now.
Summary
Key Takeaways
- Solana attracted over $900 million in net real-world asset inflows in the past 30 days, leading all major blockchain platforms, per RWA.xyz data.
- The network supports over $3 billion in real-world assets and has facilitated more than $10 billion in tokenized equity volume.
- Analyst Ali Martinez flagged the first SOL SuperTrend buy signal since October 10, with upside targets at $96 and $121.
- SOL faces a stubborn $78 resistance level and posted a 2% decline in 24 hours, with trading volume falling from $4 billion to roughly $2 billion.
- Santiment data shows the 30-day moving average for active daily Solana wallets has crossed above the 50-day MA, pointing to accelerating user engagement.
Solana Leads Real-World Asset Inflows With Over $900 Million
The headline number here is significant on its own, but the context makes it more compelling. Crypto Banter highlighted these figures as evidence of robust institutional appetite for tokenized real-world assets within the Solana ecosystem — a sector analysts widely regard as one of crypto’s fastest-growing verticals right now.
Market Leadership and Network Scale
Solana’s position atop the RWA inflow rankings isn’t built on a single product or partnership. The network currently supports over $3 billion in real-world assets and has processed more than $10 billion in tokenized equity trading volume. That combination of asset depth and transactional throughput gives it a compounding advantage — more liquidity attracts more developers, which in turn attracts more capital.
Its Layer 1 architecture allows decentralized financial services, stablecoin transactions, payment systems, and consumer applications to coexist within a single infrastructure layer. That breadth matters when institutions are evaluating which chain to build on for the long term.
Tokenized Asset Volume on Solana
The $10 billion-plus in tokenized equity volume is particularly telling. Equity tokenization — converting ownership of traditional stocks and financial instruments into blockchain-based tokens — has been one of the most actively pursued use cases in institutional crypto. Solana’s ability to handle that volume at scale positions it not just as a DeFi network, but as a credible infrastructure layer for regulated financial products.
Market analyst CryptosBatman noted on X that SOL “is looking very solid here,” pointing to a clean retest of prior resistance and a breakout from a bullish falling wedge formation, concluding it “should continue higher from here.”
Technical Analysis Signals Bullish Momentum for SOL
Beyond the on-chain fundamentals, the technical picture for SOL has shifted meaningfully in recent weeks.
SuperTrend Buy Signal Since October 10
Analyst Ali Martinez identified a key technical shift: the ATR trailing stop indicator has flipped below SOL’s current price, generating the first SuperTrend buy signal since October 10. In technical analysis, this kind of signal — where a trend-following indicator confirms price is trading above a dynamic support threshold — is typically read as confirmation of an emerging bullish phase rather than a short-term bounce.
Martinez flagged $96 as the next resistance target, with $121 as a further upside level if buying pressure sustains. On the downside, he highlighted $60 as the key level to watch — a failure there would meaningfully alter the bullish thesis.
Key Price Resistance and Support Levels
Despite the technical optimism, SOL hasn’t broken through cleanly. The $78 price barrier remains the immediate obstacle, and the asset slipped approximately 2% over a 24-hour period recently. A trend line support level sits around $74; a breakdown there opens a path toward $64 before the next meaningful floor. Conversely, a confirmed close above $78 would target the $90 level next.
The gap between the technical buy signal and the actual price action is worth noting. A SuperTrend signal doesn’t guarantee follow-through — it signals alignment of conditions, not an outcome. What happens at $78 in the near term will likely define whether the bullish scenario gets a chance to develop.
Market Activity and Trading Volume Trends
Decline in Trading Volume and ETF Outflows
Not everything in the data points in the same direction. Trading volume for SOL dropped from $4 billion to roughly $2 billion recently, a contraction that typically reflects either cooling speculative interest or a consolidation phase before the next directional move. The timing matters — volume compression during a resistance test often precedes a breakout or breakdown, making the $78 level even more pivotal.
Solana ETF flows also reversed. After recording inflows exceeding $1.1 million the previous week, the product saw $700,000 in outflows this week — a relatively small absolute figure, but directionally notable given the bullish narrative building around the network’s RWA dominance.
Increasing User Activity on Solana
The more encouraging signal comes from Santiment’s blockchain analytics. The 30-day moving average for active daily Solana wallet addresses has crossed above the 50-day moving average — a crossover that suggests user engagement is not just holding steady but accelerating. The widening gap between the two averages indicates the trend is gaining pace, which historically correlates with sustained network demand rather than a temporary spike.
User activity metrics like this tend to be more durable indicators of ecosystem health than short-term price or volume data. Rising wallet activation while price consolidates can set up a stronger base for eventual price discovery.
Competitive Landscape: Solana vs. Robinhood Chain
Robinhood’s launch of Robinhood Chain — a blockchain platform built specifically for tokenized equities and financial instruments — generated inevitable comparisons with Solana. But the framing of direct competition may be misleading.
According to Solana Daily, the two platforms serve fundamentally different purposes. Robinhood Chain leverages its retail investor network and existing brokerage relationships to deliver tokenized equities within a controlled environment. Solana, by contrast, offers open public blockchain infrastructure with deep on-chain liquidity, a large developer ecosystem, and a broader range of financial applications beyond equities alone.
Where Robinhood Chain brings a defined user base and regulatory familiarity, Solana brings composability and permissionless access. These aren’t the same product targeting the same user — they’re different bets on how tokenized finance evolves. The more interesting question isn’t which one wins, but whether Robinhood Chain’s launch signals that the tokenized equity market is large enough to sustain multiple specialized infrastructure layers — and whether that ultimately expands the total addressable market that Solana is already leading.
FAQ
How much capital has Solana attracted in real-world asset inflows recently?
Solana attracted over $900 million in net real-world asset inflows in the past 30 days, according to data from RWA.xyz, placing it ahead of all other major blockchain platforms during that period.
What technical indicators suggest a bullish trend for Solana’s price?
Analyst Ali Martinez identified that the ATR trailing stop indicator has flipped below SOL’s current price, generating the first SuperTrend buy signal since October 10. This is interpreted as a technical confirmation of a bullish phase, though it does not guarantee sustained price gains.
What are the key resistance and support levels for SOL’s price?
The immediate resistance sits at $78, followed by $90. If momentum builds, analysts cite $96 and $121 as upside targets. On the support side, $74 is a near-term trend line floor, with $64 below that and $60 identified as the critical level to watch.
How does Solana’s blockchain differ from Robinhood Chain?
Solana is a public Layer 1 blockchain with broad on-chain liquidity, a large developer community, and a wide range of financial applications. Robinhood Chain is purpose-built for tokenized equities and targets Robinhood’s existing retail investor base. According to Solana Daily, they serve different purposes rather than competing directly.
Article produced with the assistance of artificial intelligence and reviewed by the editorial team.