



RTX Corporation stock closed at $194.88 on July 22, 2026, sitting above all three major daily exponential moving averages. Yet intraday momentum is fading ahead of Thursday’s Q2 earnings. The short-term setup carries meaningful event risk despite the structurally bullish foundation.
Summary
Key takeaways
- RTX Corporation stock closed at $194.88 on July 22, 2026, above the daily EMA20, EMA50, and EMA200
- The daily RSI stands at 56.38, offering room for further upside before reaching overbought territory
- The hourly regime has shifted to neutral, with price below both the 1H EMA20 and EMA50
- Q2 earnings are due Thursday before market open, introducing binary event risk
- The daily ATR of 4.63 signals that five-point post-earnings swings are well within range
Daily Timeframe: The Bullish Foundation in RTX Corporation Stock
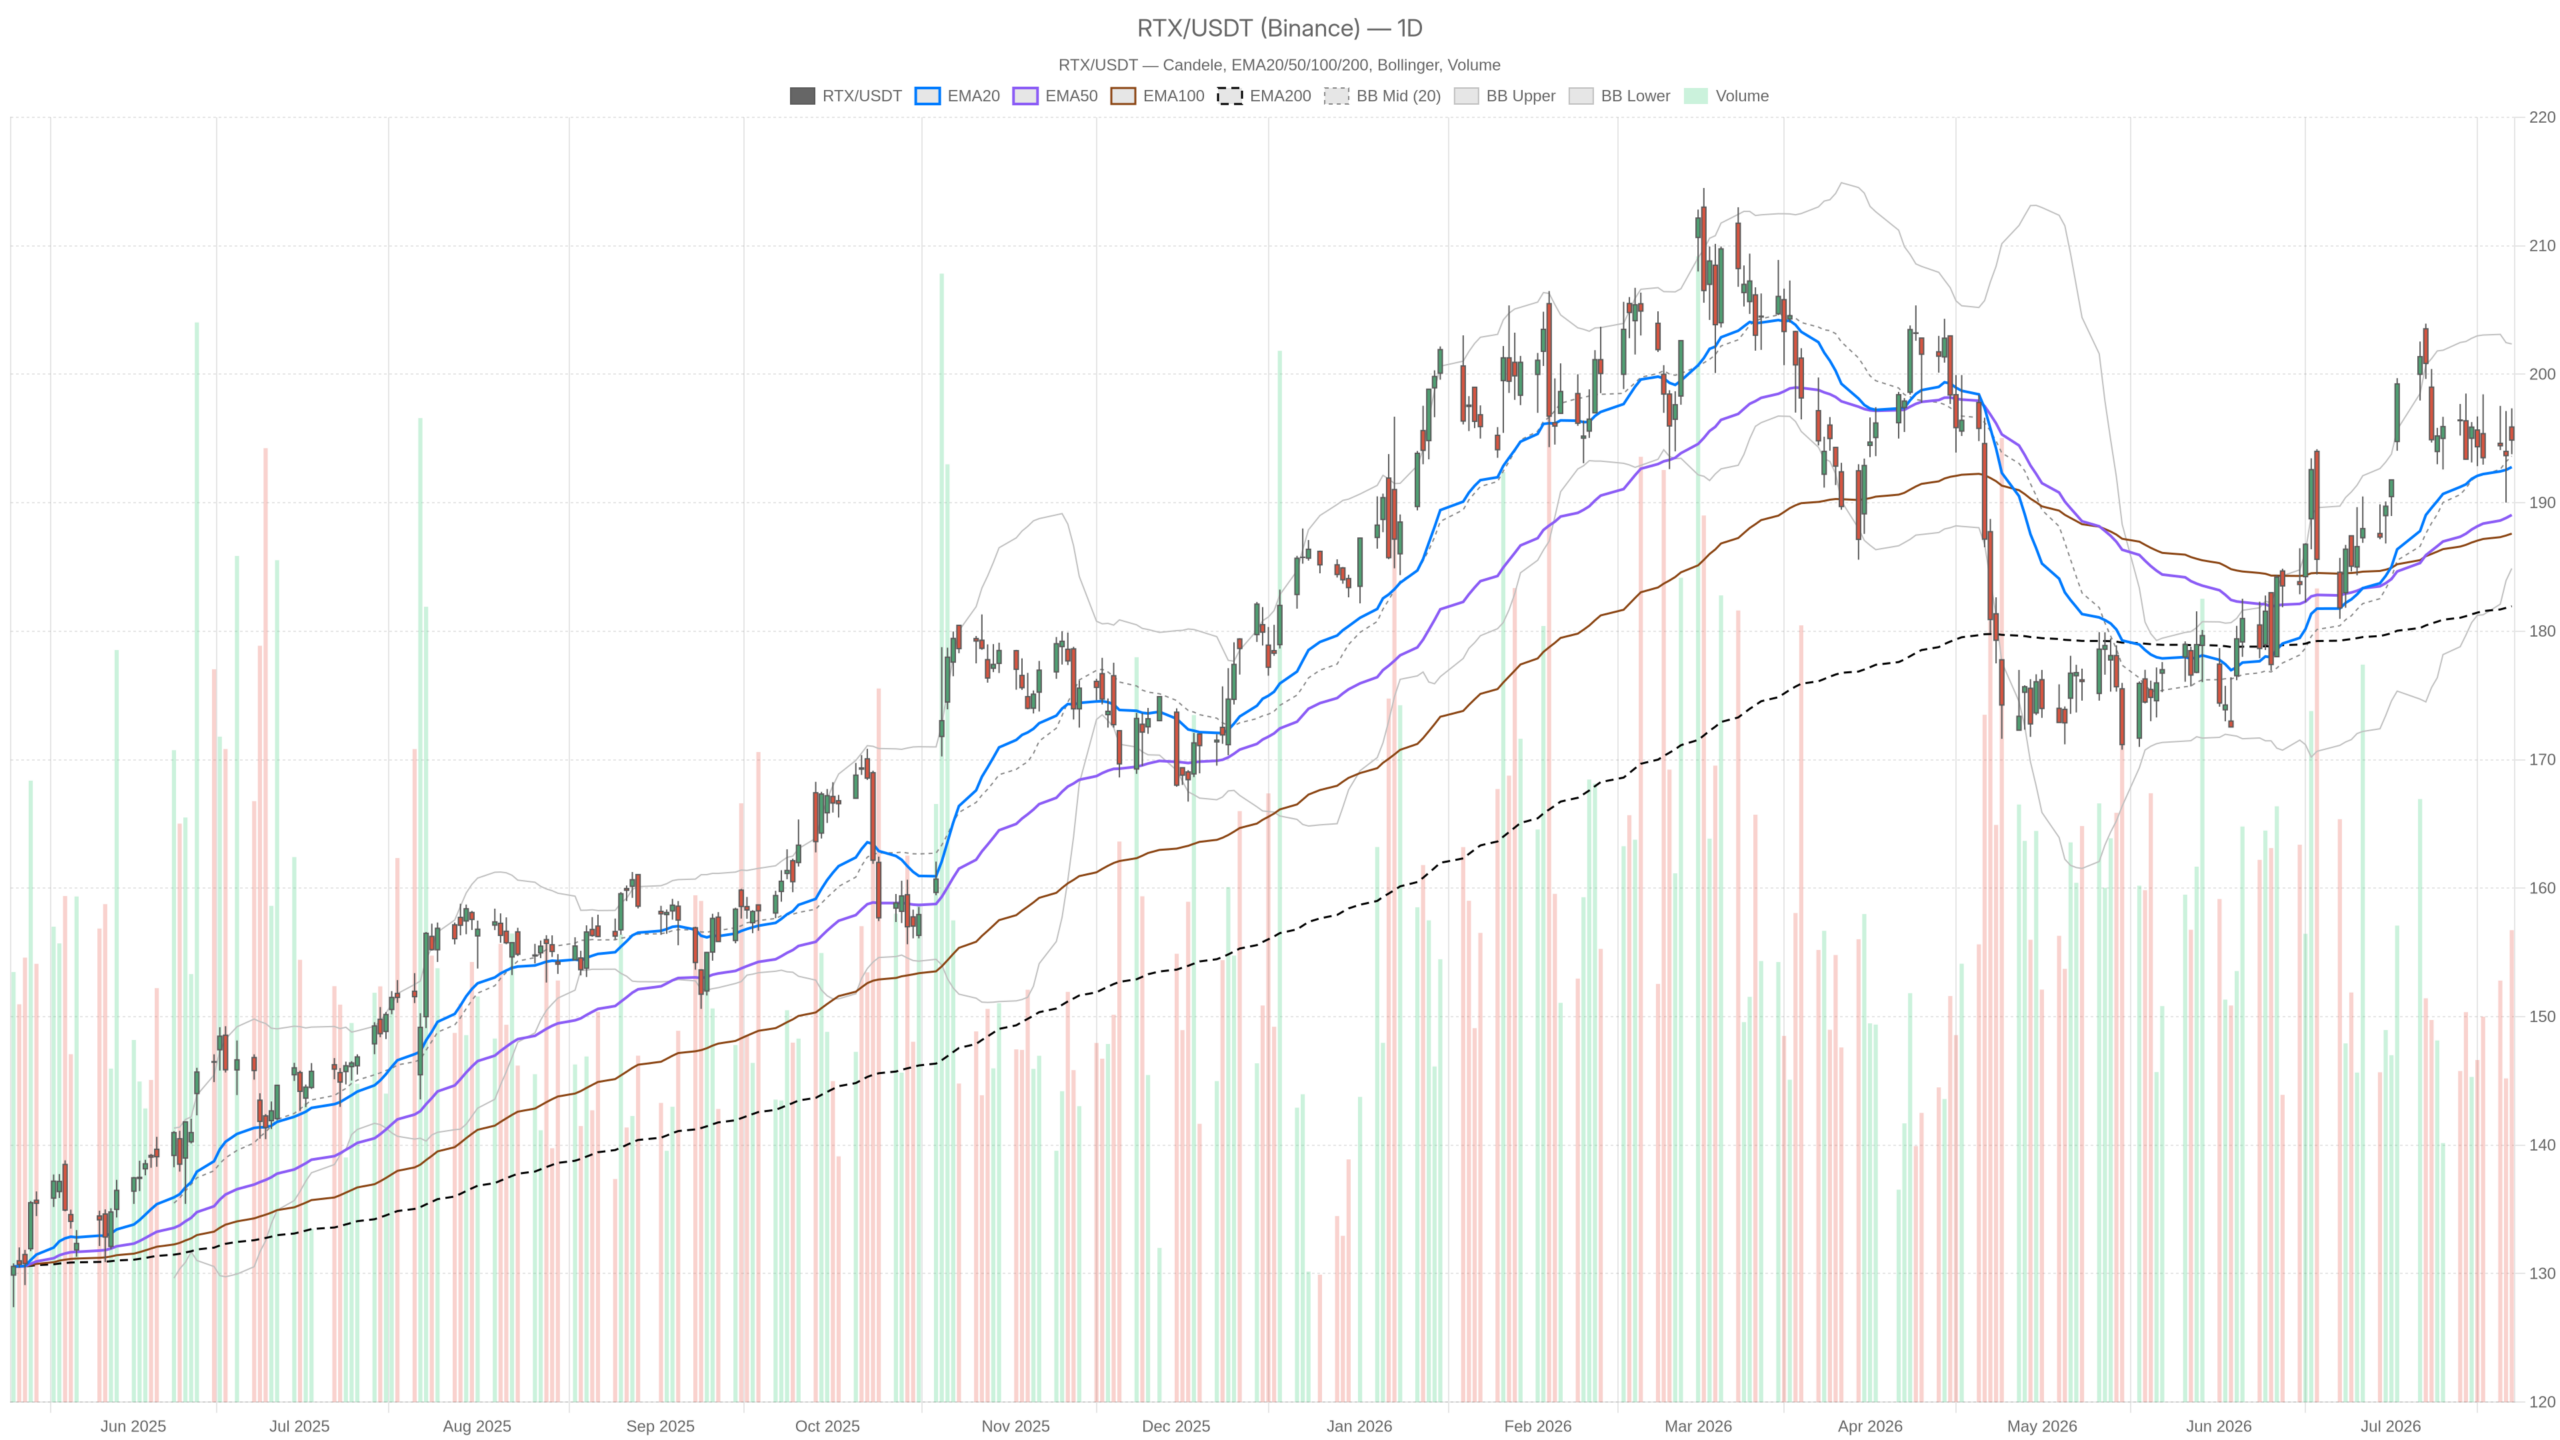
The daily chart confirms a firmly bullish structure for RTX Corporation stock. Price sits above the EMA20 at $192.78, the EMA50 at $189.05, and the EMA200 at $181.95. That stacked EMA alignment confirms a well-established uptrend. The gap between the EMA50 and EMA200 alone — nearly seven points — reflects sustained buying pressure over multiple months.
The daily RSI at 56.38 reinforces this view, sitting in positive territory without being overbought. There is room for further upside before momentum becomes stretched. Meanwhile, the MACD line at 2.56 remains above zero. However, the signal line at 3.17 has edged ahead, producing a histogram of -0.61. That mild negative reading indicates daily momentum has decelerated slightly from its recent peak.
Notably, Bollinger Bands place the mid-band at $193.63, with the upper at $202.36 and the lower at $184.89. RTX trades above the mid-band — another confirming signal. The ATR14 at 4.63 reflects meaningful daily volatility, normal for a stock at this price level. Daily pivot analysis adds further precision. The pivot sits at $195.34, with resistance R1 at $196.89 and support S1 at $193.32. RTX closed just below its daily pivot, a mild soft spot rather than a structural concern.
Hourly Signals Introduce Caution
However, the 1H chart complicates the clean daily picture with a neutral regime classification. Price at $194.72 sits below both the 1H EMA20 at $195.07 and the 1H EMA50 at $195.20. That near-term positioning shows sellers have been more active in recent hours. RTX is trading at the lower half of its intraday range.
The hourly RSI at 47.79 sits nearly flat at the midpoint — neither bullish nor bearish. It suggests indecision rather than directional conviction. On the MACD side, the hourly line reads -0.21 against a signal of -0.11. The resulting histogram of -0.10 confirms short-term momentum has tilted downward, though the reading remains small.
In contrast, the 1H EMA200 at $191.13 still sits well below price. This keeps the medium-term hourly structure intact. The hourly Bollinger mid-band at $195.41 acts as near-term resistance. Until RTX reclaims that level, intraday pressure remains slightly bearish. The 1H pivot at $194.58 sits close to current price, making the zone between $193.91 and $195.38 the immediate battlefield.
15-Minute Chart: A Bearish Lean in Execution Context
Stepping down to the 15-minute chart, the regime turns bearish. Price closed at $194.72, below all three EMAs: the EMA20 at $194.78, EMA50 at $195.11, and EMA200 at $195.67. That full EMA stack above price is a short-term bearish signal. It confirms the intraday recovery attempt has not been strong enough to flip execution momentum positive.
At the same time, the 15m RSI at 47.75 mirrors the hourly reading — neutral and directionless. The MACD histogram at -0.07 is marginally negative. The 15m ATR at 0.49 is tight, indicating compressed near-term volatility. That compression, just ahead of Thursday’s earnings, is typical of markets awaiting a catalyst. Bollinger Bands have narrowed, with the upper at $195.74 and lower at $194.05. This Bollinger squeeze often precedes a sharp directional move.
Fundamental Backdrop: Catalysts Building for RTX
The fundamental backdrop for RTX remains strong, driven by aerospace demand, defense contracts, and a growing backlog. The company heads into Q2 earnings with expectations for revenue and EPS growth. At the Farnborough Airshow, BOC Aviation placed an order for up to 220 Pratt & Whitney GTF engines — a significant commercial win.
Additionally, the Omnia Training consortium, led by RaytheonUK, secured a £2.00 billion, 15-year UK Ministry of Defence contract. The deal covers digitally enabled collective training for the British Army. Meanwhile, Raytheon and Pratt & Whitney units advanced missile development alongside AI-related efforts.
Furthermore, RTX has been identified as a drone technology stock worth monitoring as adoption accelerates. These developments collectively reinforce the bull case: diversified defense revenue streams, growing commercial aerospace demand, and high-value long-term contracts. Backlog visibility alone tends to support multiple expansion during periods of geopolitical uncertainty.
Bullish Scenario: What Would Support the Upside
For the bullish case to materialize, RTX needs to reclaim its daily pivot at $195.34 and hold above it on a closing basis. A strong Q2 earnings beat — particularly with margin expansion or backlog upgrades — could be the catalyst to push price toward R1 at $196.89. From there, the Bollinger upper band at $202.36 becomes a realistic target.
On the hourly chart, a decisive break above $195.41 and $195.20 would confirm renewed intraday conviction. The underlying daily EMA structure and RSI with room to run both argue that the path of least resistance remains higher. That thesis holds provided earnings deliver.
Bearish Scenario: What Would Invalidate the Bull Case
On the other hand, a disappointing earnings report could change the picture quickly. If RTX fails to hold daily support at $193.32 on a post-earnings close, attention shifts to the EMA20 zone at $192.78. A break below that level would meaningfully weaken the bullish structure.
The MACD histogram already shows mild deceleration on the daily frame. Should that deteriorate further post-earnings, it would add weight to the bearish case. A drop toward the EMA50 at $189.05 becomes plausible in a risk-off scenario. The 15m bearish regime, combined with the hourly neutral read, means the stock enters earnings without strong intraday momentum behind it.
Positioning and Volatility Into the Catalyst
Overall, RTX Corporation stock presents a fundamentally supported bullish structure on the daily timeframe, complicated by softening short-term momentum. The daily EMA alignment, RSI positioning, and regime classification all point higher. Still, the hourly and 15-minute charts reflect a stock that has lost near-term drive. Price sits below its intraday moving averages with a bearish micro-regime.
The 15m Bollinger squeeze and compressed ATR signal that a volatility expansion is imminent. With earnings due Thursday, the next directional move is unlikely to come from technicals alone. Traders should size positions with the ATR in mind. At 4.63 on the daily chart, swings of five points or more post-earnings are well within range. The bias remains cautiously bullish, but event risk is real and timing demands discipline.
FAQ
What is the current price of RTX Corporation stock?
RTX Corporation stock closed at $194.88 on July 22, 2026, sitting above all three major daily exponential moving averages.
When are RTX’s Q2 earnings released?
RTX reports Q2 earnings on Thursday before market open, making it a binary event for short-term positioning.
What are the key support levels for RTX stock?
Key support sits at $193.32 (daily S1), followed by the EMA20 at $192.78. A break below this zone would shift attention to the EMA50 at $189.05 and potentially weaken the bullish daily structure.
What is the daily trend for RTX Corporation stock?
The daily trend is firmly bullish, with price above the EMA20 ($192.78), EMA50 ($189.05), and EMA200 ($181.95). The stacked EMA alignment confirms a well-established uptrend, supported by an RSI of 56.38 that leaves room for further upside.
Disclaimer: This article is for informational purposes only and does not constitute financial advice, an investment recommendation, or a solicitation to buy or sell any financial instrument or cryptocurrency. The analysis provided is not indicative of future results. Investing in crypto assets and financial markets carries a high risk of capital loss. Always do your own research (DYOR) and consult a qualified financial advisor before making any decision.
Article produced with the assistance of artificial intelligence and reviewed by the editorial team.
