




SUI sits between two conflicting stories on August 19, 2026. The daily chart stays bearish, while hourly and 15-minute readings hover near neutral. That gap defines the Sui price crypto setup and matters more than any single directional bet right now.
Summary
Key takeaways
- SUI trades at 0.66 and remains below the EMA20 (0.68), EMA50 (0.71), and EMA200 (0.97) on the daily chart.
- The daily RSI sits at 37.55, while 1-hour and 15-minute momentum readings hover near neutral.
- The Fear & Greed Index reads 46 and total crypto market cap is up just 0.44% over 24 hours.
- DeepBook V3 fees rose 52.28% over 24 hours even as most Sui DEX activity cooled.
- Support at 0.65 and a reclaim of the daily EMA20 near 0.68 are the key levels to watch.
This setup matters because SUI is fighting its own chart while broader risk appetite stays lukewarm. The Fear & Greed Index sits at 46, firmly in fear territory, and total crypto market cap is up just 0.44% over 24 hours, according to CoinGecko. Meanwhile, Bitcoin dominance remains roughly 56.5%, so capital is not rotating aggressively into altcoins like SUI.
The Daily Chart
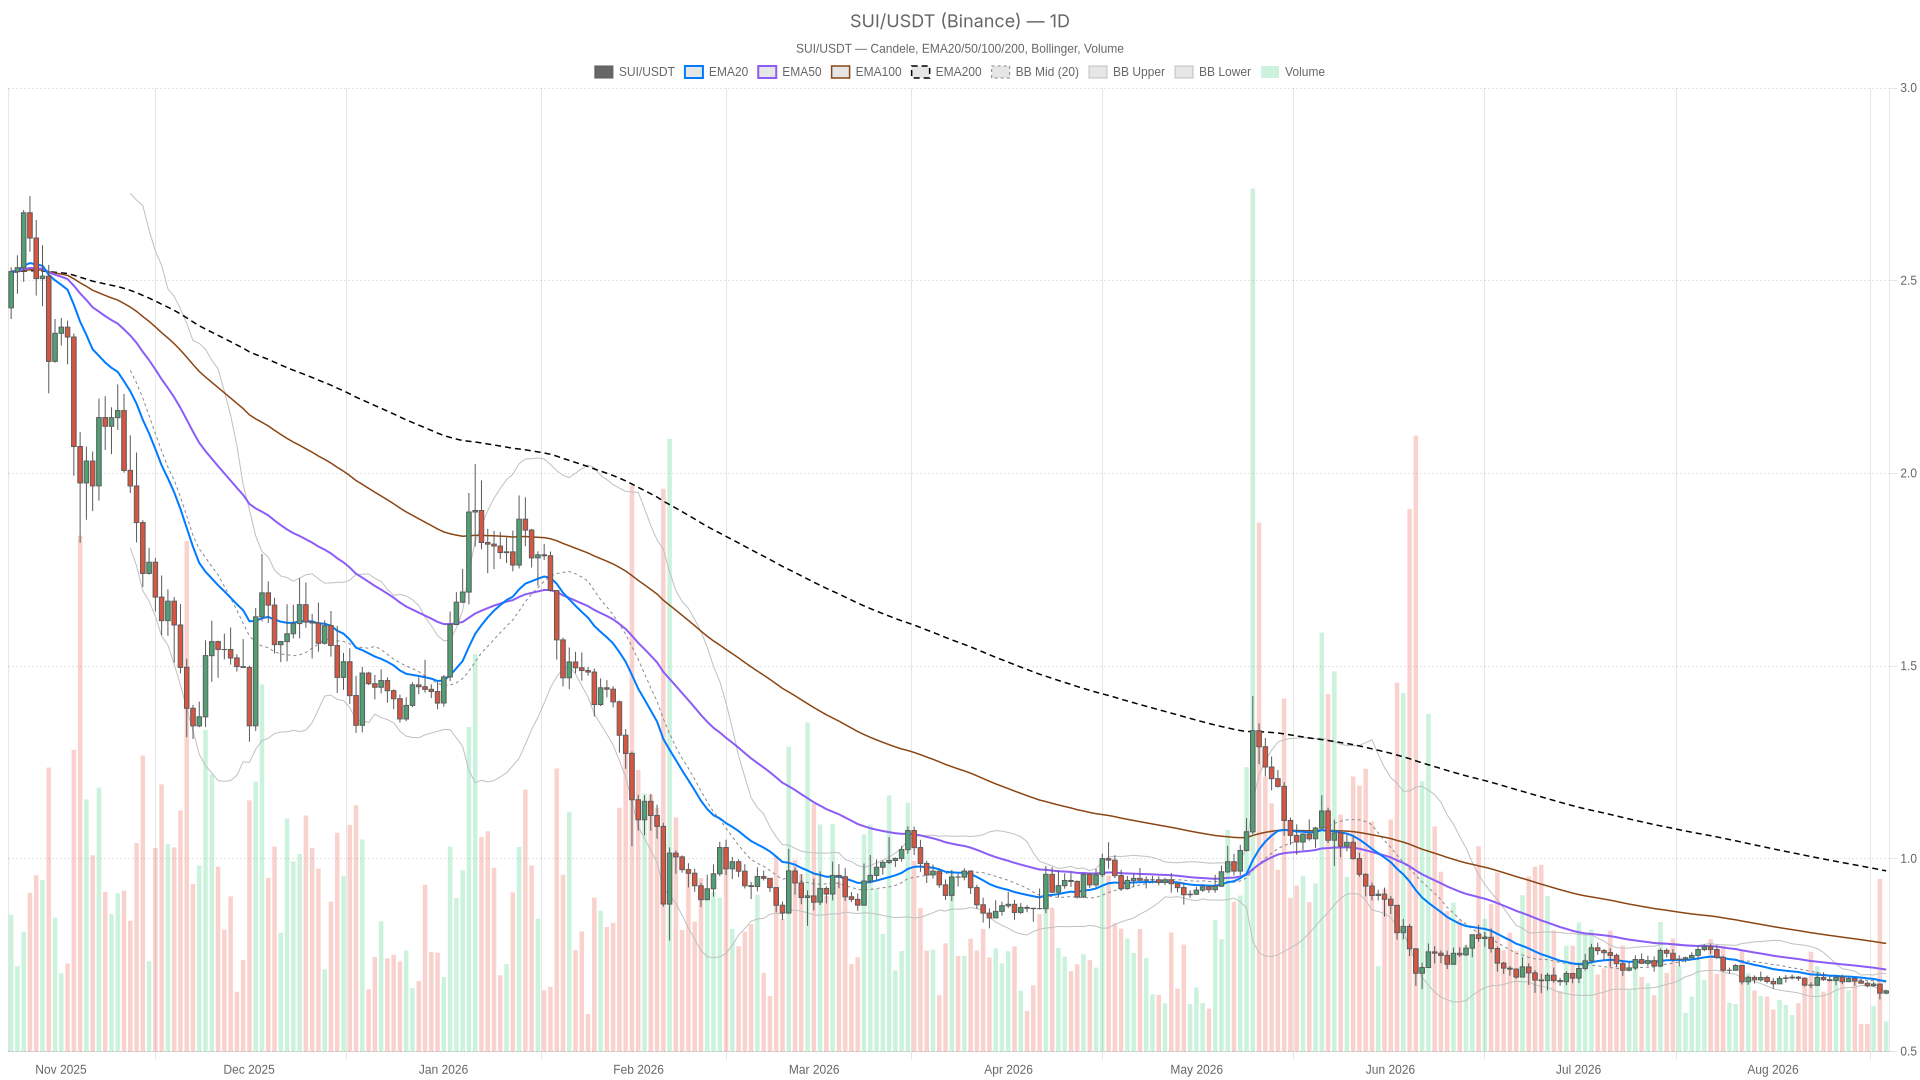
The daily chart remains bearish, with SUI trading at 0.66 below every major moving average. Price sits under the EMA20 at 0.68, the EMA50 at 0.71, and the EMA200 at 0.97. That stack forms a textbook downtrend alignment rather than a market flirting with a trend change.
RSI on the daily sits at 37.55, soft without being outright oversold. Still, that leaves room to fall further before exhaustion. The MACD line and signal are both at -0.01 with a flat histogram. Downside momentum has stopped accelerating but has not reversed either.
Daily Bollinger Bands are tight, with the mid at 0.68, upper at 0.70, and lower at 0.66. Price rests on the lower band, consistent with grinding along the bottom of a range. ATR14 at 0.02 confirms compressed volatility. Support pivot at 0.65 sits just beneath current price.
1H and 15m: Momentum Has Gone Quiet
Momentum has gone quiet on the lower timeframes, with no clear directional conviction. On the 1-hour chart, the regime flips to neutral. Price, EMA20, and EMA50 bunch around 0.66, with the EMA200 just above at 0.67. RSI has climbed to 51.98 and MACD has flattened to zero.
The 15-minute chart shows EMAs stacked at 0.66, RSI at 53.09, and a flat MACD. Still, the daily trend remains bearish while shorter timeframes show no active selling pressure. That is not necessarily bullish. It may simply mean sellers are pausing near support before the next leg down.
Ecosystem Activity
Sui’s DeFi activity is cooling overall, but DeepBook V3 stands out with rising fees. Fee generation has dropped over the past week and month across Cetus CLMM, Bluefin Spot, Momentum, and Turbos, according to DefiLlama. Bluefin Spot fees are down 22.48% over 7 days, while Turbos is down nearly 44% over the same window.
That said, DeepBook V3 is the exception, with fees up 52.28% over 24 hours and 60.94% over 30 days. That pocket of strength suggests not all network activity is fading, even if the aggregate trend is cooling.
Bullish Scenario
A constructive turn in the Sui price crypto outlook would require SUI to reclaim the daily EMA20 near 0.68 and hold above it. Ideally, RSI pushes back above 40-50 on the daily to confirm sellers are losing grip. A close back above the EMA50 at 0.71 would be a much stronger signal. Until then, any bounce off the 0.65-0.66 zone should be treated as a relief move within a larger downtrend.
The neutral 1H and 15-minute readings do leave room for a squeeze if buyers step in with conviction, since lower timeframes carry no momentum resistance right now.
Bearish Scenario
More downside is confirmed if SUI loses the 0.65 support pivot while still trading below the daily EMA20 and EMA50. Moreover, a clean break of 0.65 would open the door to a deeper move. Low ATR readings often resolve with a sharp expansion rather than a gradual drift.
The daily regime is already flagged bearish and RSI has not hit oversold extremes. That leaves technical room for the decline to extend before any exhaustion signal appears. The EMA200 at 0.97 remains a distant reference point, underscoring how far price has fallen from the longer-term trend.
Where This Leaves Traders
SUI is a market without a clear short-term catalyst, sitting in a tight range while the daily trend still leans bearish. Compressed volatility on the daily ATR and Bollinger Bands suggests the calm is unlikely to last. Ranges this tight tend to break in one direction, and the move can happen quickly.
Fear & Greed sits at 46 and Bitcoin dominance commands over half the total market. There is little evidence of broad rotation into altcoins that would give SUI an external tailwind. The key tells are whether price reclaims the daily EMA20 or loses the 0.65 support.
As always in a market this compressed, position sizing and awareness of sudden volatility matter more than trying to predict the exact direction in advance.
FAQ
Is SUI still in a daily downtrend?
Yes. SUI trades at 0.66, below the EMA20 at 0.68, the EMA50 at 0.71, and the EMA200 at 0.97. The daily RSI sits at 37.55.
What would confirm a bullish reversal for SUI?
A reclaim of the daily EMA20 near 0.68 and a close above the EMA50 at 0.71 would strengthen the case. Until then, bounces off the 0.65-0.66 zone remain relief moves within a downtrend.
Why does SUI look neutral on the 1-hour and 15-minute charts?
The shorter timeframes show price and moving averages bunched around 0.66, with RSI near 51.98 on the 1-hour chart and 53.09 on the 15-minute chart. Momentum has flattened to zero.
Which Sui DeFi protocol is showing fee growth?
DeepBook V3 is the standout, with fees up 52.28% over 24 hours and 60.94% over 30 days. Bluefin Spot, by contrast, is down 22.48% over 7 days.
Disclaimer: This article is for informational purposes only and does not constitute financial advice, an investment recommendation, or a solicitation to buy or sell any financial instrument or cryptocurrency. The analysis provided is not indicative of future results. Investing in crypto assets and financial markets carries a high risk of capital loss. Always do your own research (DYOR) and consult a qualified financial advisor before making any decision.
Article produced with the assistance of artificial intelligence and reviewed by the editorial team.
