




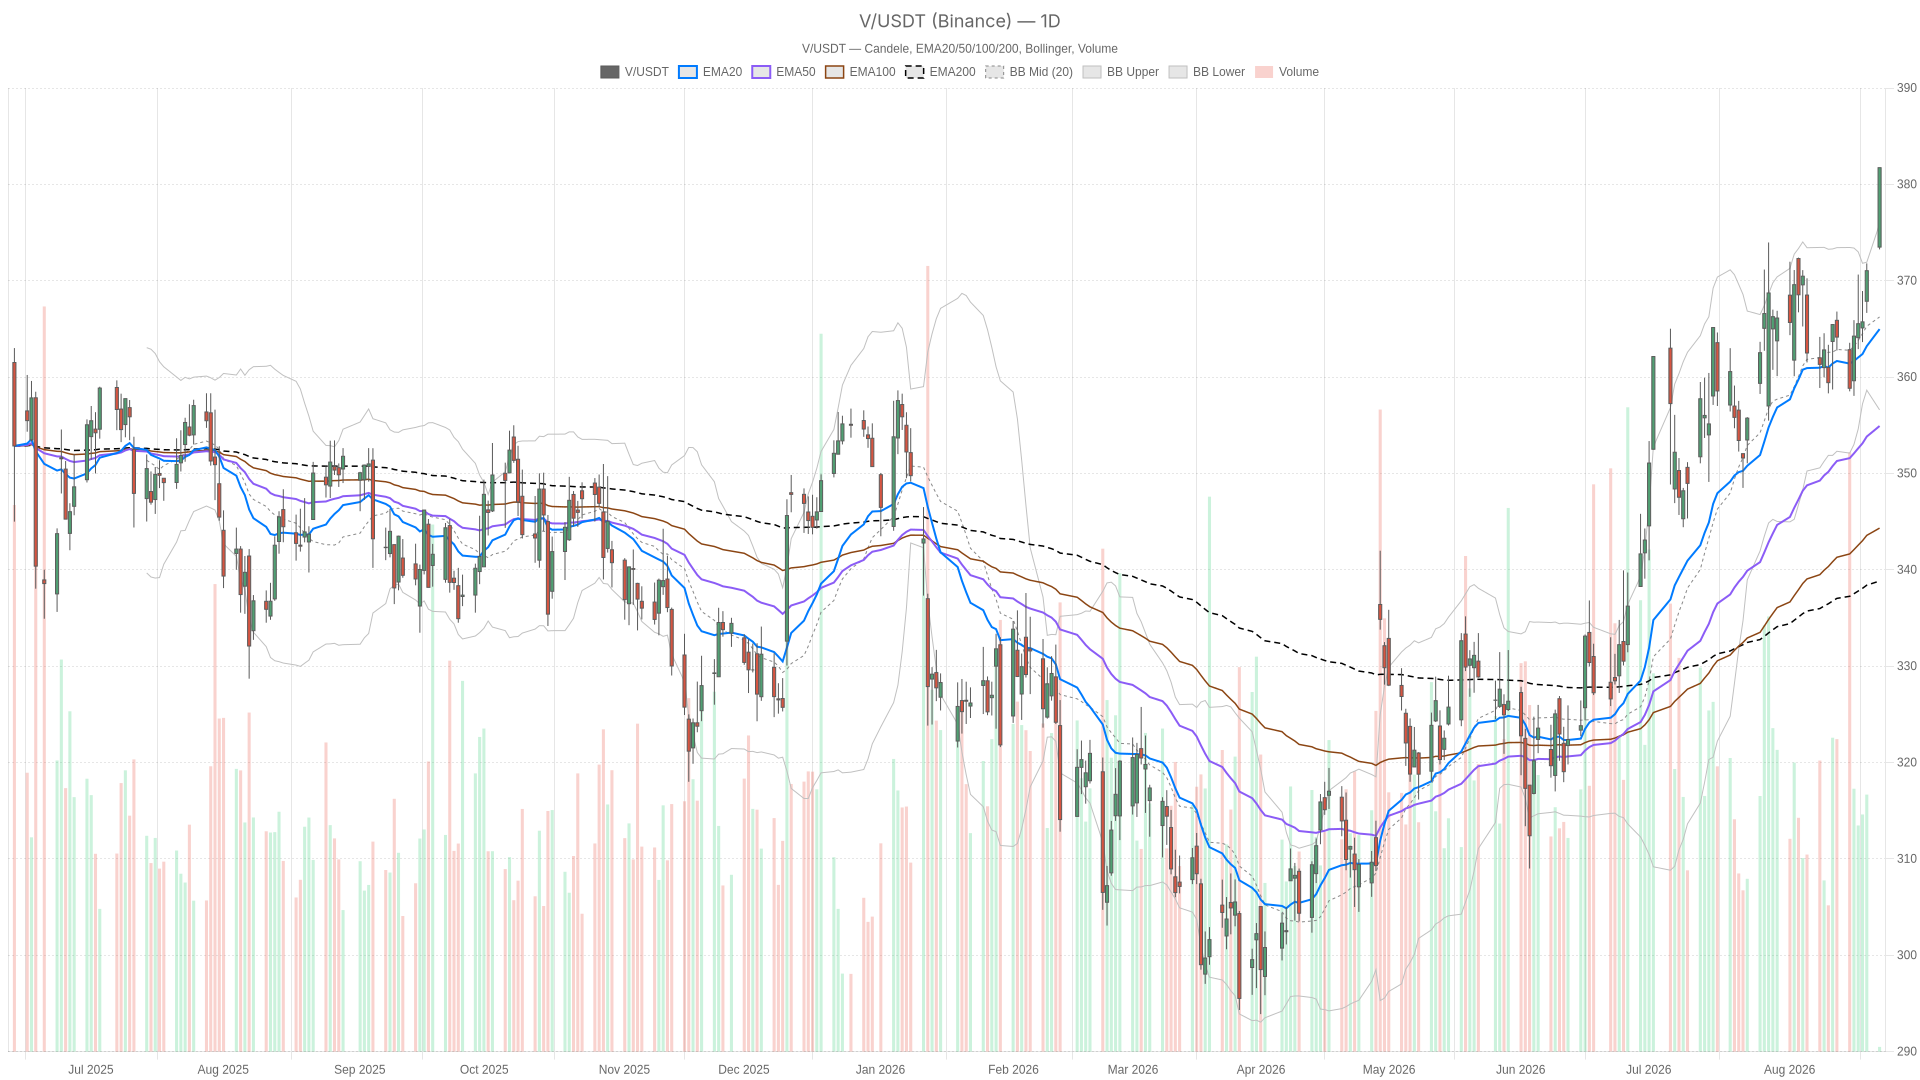
Visa Inc. stock closed at $381.73, clearing its 52-week high of $374.20 with conviction. Price sits above every major moving average, confirming a structurally bullish trend. However, momentum indicators across shorter timeframes are now stretched, raising questions about the rally’s near-term sustainability.
Summary
Key takeaways
- Visa Inc. stock closed at $381.73, above all major moving averages on the daily chart.
- The daily RSI14 at 68.99 signals strong buying pressure but is approaching overbought territory.
- The 1H RSI14 has climbed to 79.92, deep in overbought territory.
- A break above $384.56 (daily R1) would validate further upside extension.
- Failure to hold $376.08 (daily S1) could trigger a deeper correction toward $366.24.
Daily Trend for Visa Inc. Stock: Bullish but Stretched
The daily structure for Visa Inc. stock is unambiguously bullish. Price at $381.73 sits comfortably above the EMA20 ($364.98), EMA50 ($354.92), and EMA200 ($338.84)—a textbook bullish stacking pattern.
Momentum and Volatility Indicators
The RSI14 at 68.99 reflects strong buying pressure. However, it is approaching the threshold where pullbacks typically begin to surface. Meanwhile, the MACD line at 4.51 remains above its signal line at 4.02, with a positive histogram of 0.49. This confirms upward momentum is still intact, even if it has decelerated slightly from its peak thrust.
Price is trading near the upper Bollinger Band ($375.88), well above the midline ($366.24). This signals volatility expansion favoring buyers. The ATR14 of 6.39 reflects a market moving with real conviction, not drifting.
Key Pivot Levels to Watch
The daily pivot point at $378.90 has already been cleared. Price is now pressing toward R1 at $384.56. On the downside, S1 at $376.08 marks the first meaningful support below current levels. These levels frame the immediate battleground as momentum stretches.
1H Chart for Visa Inc. Stock: Bullish Bias With a Warning
The 1-hour timeframe confirms the daily bullish bias for Visa Inc. stock while adding a cautionary note. Although the EMA alignment remains constructive, the RSI14 has climbed to 79.92, deep in overbought territory.
Overbought Signals and Pivot Compression
EMA20 ($370.79), EMA50 ($367.51), and EMA200 ($361.51) are all aligned bullishly. The regime here is also tagged “bullish.” However, price at $381.73 has pushed above the upper Bollinger Band ($378.05). This condition often precedes at least a short-term pause, even within a healthy uptrend.
The MACD still supports the bulls, with the line at 2.97 above the signal at 1.86 and a histogram of 1.11 showing accelerating momentum. Still, the 1H pivot point sits at $381.02. R1 at $382.44 and S1 at $380.31 frame a tight battleground just above and below current price.
15-Minute Chart Signals Extreme Extension
The 15-minute chart shows an even more pronounced extension. RSI14 has spiked to 87.36, an extreme reading that typically signals short-term exhaustion rather than sustainable continuation.
The MACD histogram at 0.98 still points higher, and price remains above all EMAs on this timeframe. However, price sits right at the pivot R1 ($381.98) and just above the pivot point ($381.48). This timeframe is best used for timing entries or exits. In practice, this is the zone where short-term traders should expect volatility, not necessarily direction.
Bullish Scenario: Clearing $384.56 Opens the Door Higher
The bullish case for Visa Inc. stock rests on continuation above the daily pivot resistance at $384.56. A clean break and hold above that level would validate the current trend and open the door toward further upside.
For this scenario to play out, RSI readings across the daily and 1H timeframes would need to cool off without breaking the EMA20 support structure. This would allow momentum to reset while price consolidates near the highs. Notably, a pullback that respects the 1H EMA20 ($370.79) would be constructive. Rather than signaling a retreat, it would suggest buyers are simply pausing.
Bearish Scenario: Losing $376.08 Could Spark a Deeper Correction
The bearish case would take shape if price fails to hold above the daily S1 support at $376.08. A break below that level would suggest that overbought readings are finally resolving through a deeper correction.
In contrast to the bullish path, this scenario would likely see price test the daily Bollinger midline near $366.24. A breach of the daily EMA50 ($354.92) would meaningfully weaken the broader uptrend narrative. At that point, the extreme RSI readings on the 15-minute and 1H charts would tell a different story. They would look less like temporary overextension and more like an early warning that was ultimately correct.
Overall Outlook: Strong Trend, Stretched Positioning
Visa Inc. stock remains in a firmly bullish daily trend, and that structure should not be dismissed lightly. At the same time, overbought RSI readings across the 1H and 15-minute timeframes suggest near-term volatility is likely, even within the broader uptrend.
Positioning here requires balancing conviction in the primary trend against the reality that momentum has stretched quickly. No single indicator settles this tension on its own. Therefore, the coming sessions around key pivot levels should provide clarity. They will reveal whether this rally has more room to run or needs to digest its recent gains first.
FAQ
Is Visa Inc. stock still in a bullish trend?
Visa Inc. stock remains in a firmly bullish daily trend. Price at $381.73 sits above the EMA20 ($364.98), EMA50 ($354.92), and EMA200 ($338.84), forming a textbook bullish moving average stacking pattern.
What are the key resistance levels for Visa Inc. stock?
The immediate resistance is the daily R1 at $384.56. A clean break above this level would validate further upside extension. On the 1H chart, R1 sits at $382.44, with the pivot point at $381.02.
What support levels should traders watch?
The first meaningful support is the daily S1 at $376.08. Below that, the daily Bollinger midline near $366.24 becomes the next area of interest, followed by the EMA50 at $354.92.
Disclaimer: This article is for informational purposes only and does not constitute financial advice, an investment recommendation, or a solicitation to buy or sell any financial instrument or cryptocurrency. The analysis provided is not indicative of future results. Investing in crypto assets and financial markets carries a high risk of capital loss. Always do your own research (DYOR) and consult a qualified financial advisor before making any decision.
Article produced with the assistance of artificial intelligence and reviewed by the editorial team.
