




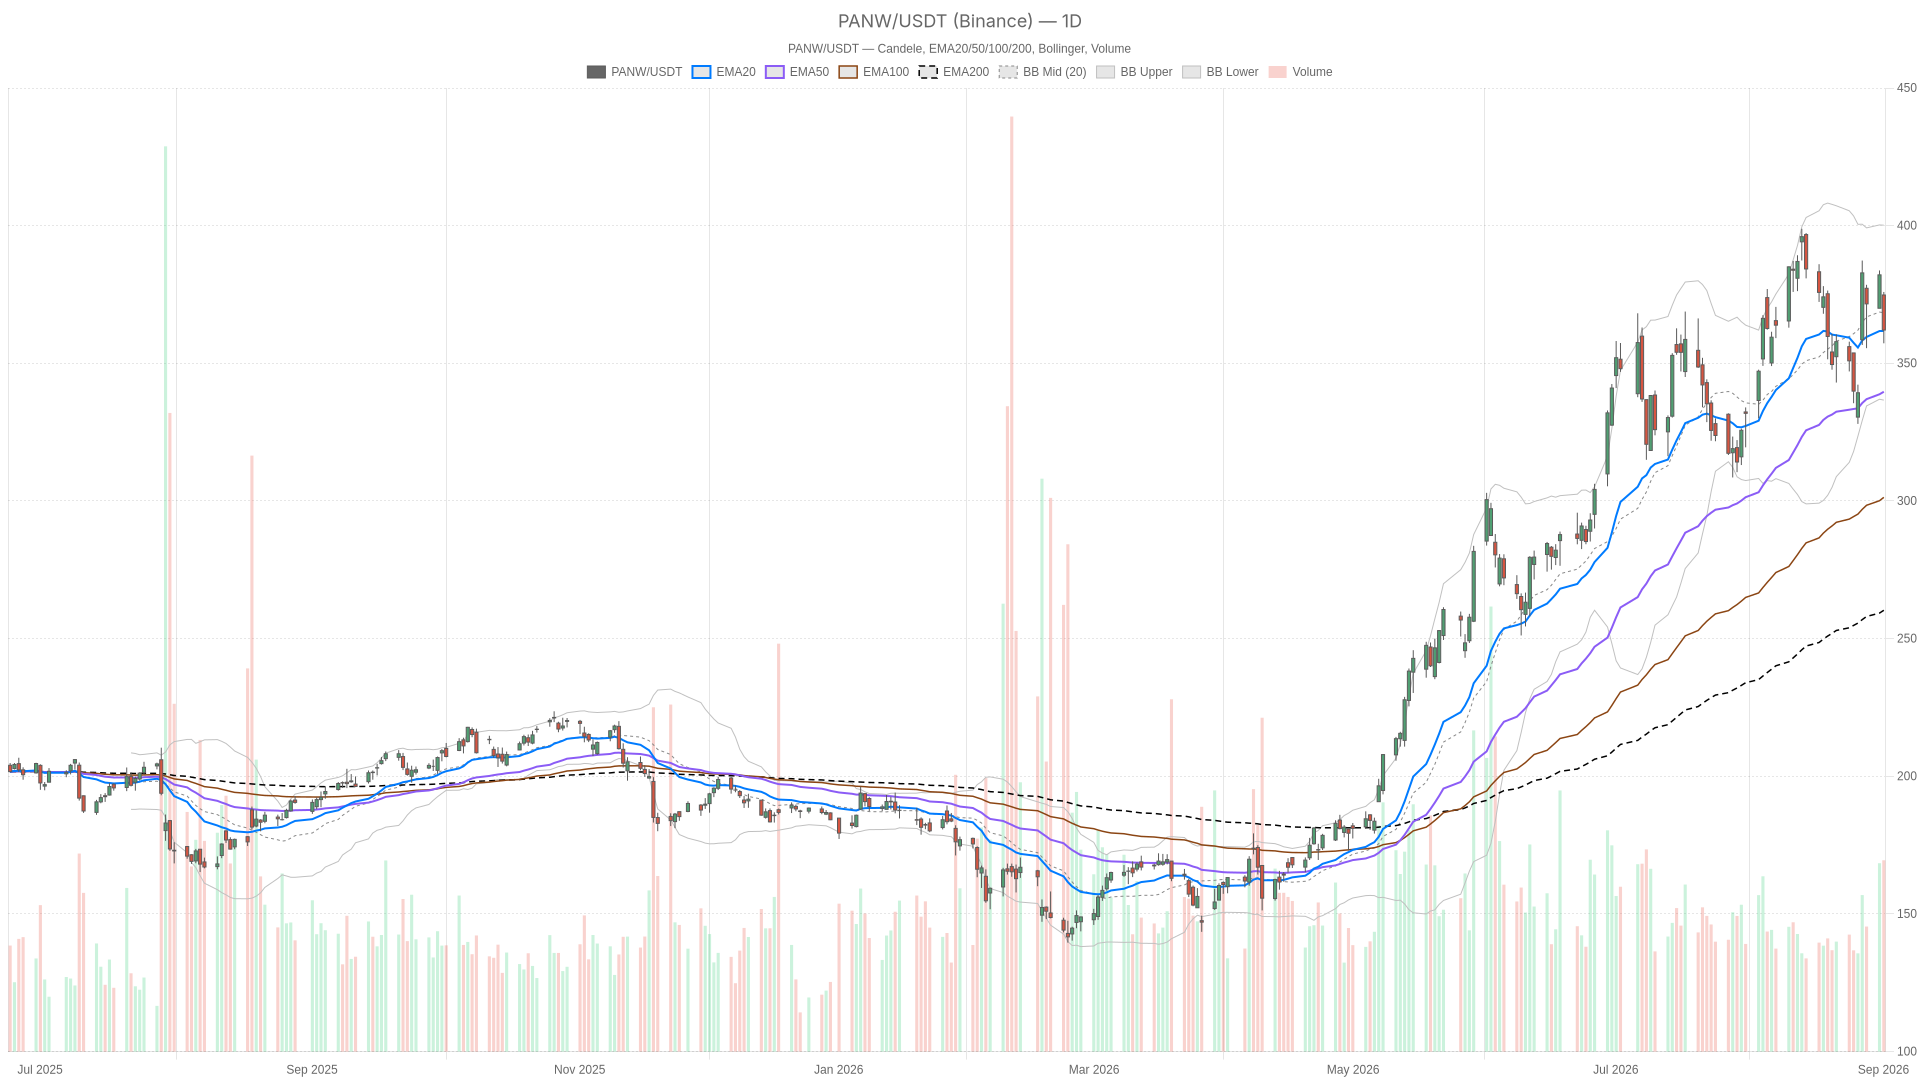
Palo Alto Networks stock dropped sharply on September 1, opening at 374.82 before sliding to close at 362.09 on heavy volume after Q4 FY26 earnings. The bearish candle lands on a still-intact uptrend, creating a tension between short-term pressure and constructive longer-term structure that demands resolution.
Summary
Key takeaways
- Palo Alto Networks stock dropped from 374.82 to close at 362.09 after Q4 FY26 earnings, forming a wide bearish daily candle on heavy volume.
- The daily trend remains bullish with price above the EMA50 at 339.67 and EMA200 at 260.30, but the MACD has crossed bearish with a negative histogram of -1.29.
- Management reported record RPO and expanding NGS ARR, with FY2027 revenue guidance of $14.1 billion to $14.2 billion.
- The hourly chart confirms short-term momentum weakness, with price below both EMA20 and EMA50 but still holding above the EMA200 at 359.12.
- Daily ATR14 at 18.92 signals elevated post-earnings volatility, with next key supports at S1 354.27 and the EMA50 at 339.67.
Daily Trend: Palo Alto Networks Stock Maintains Bullish Structure
Palo Alto Networks stock remains in a bullish daily trend, with price at 362.09 well above the EMA50 at 339.67 and the EMA200 at 260.30. Short-term momentum, however, has stalled. Price is now trading almost exactly on the EMA20 at 361.76. The daily regime reading itself is tagged bullish.
The RSI14 at 51.47 backs that neutral read. It is neither overbought nor oversold, consistent with a market digesting a sharp move rather than trending hard in either direction. More telling is the MACD, where the line at 6.28 sits below the signal at 7.57. This produces a negative histogram of -1.29 — a bearish cross on momentum, even as the broader trend context remains up.
Meanwhile, the Bollinger setup shows price at 362.09 below the mid-band of 368.40. The lower band sits at 336.63 and the upper band at 400.17. This leaves plenty of room in either direction, with no sign of an extreme stretch yet.
Notably, volatility itself deserves attention. The ATR14 on the daily chart stands at 18.92, a wide reading confirming large post-earnings increments. On the pivot framework, price sits between the pivot point at 365.09 and S1 at 354.27 — closer to the pivot but clearly on the defensive side. R1 at 372.92 marks the level bulls would need to reclaim to shift sentiment decisively.
1H Timeframe: Short-Term Fade Within the Uptrend
The hourly chart confirms short-term selling pressure within the broader uptrend. Price at 362.25 sits below both the EMA20 at 366.47 and EMA50 at 364.54, yet still holds above the EMA200 at 359.12. This is a classic pullback signature — a market that has broken its immediate momentum structure but has not yet damaged the more durable trend line underneath.
At the same time, momentum on the 1H chart leans bearish. RSI14 at 45.54 is below the midpoint. The MACD line at -0.85 sits well under the signal at 1.58, generating a histogram of -2.43. That wider negative gap, compared to the daily chart, suggests the short-term selling pressure is more pronounced than the daily alone would imply.
The hourly regime is labeled neutral, which fits the picture. This is not a clean breakdown, but it is not a confirmed bounce either. On the pivot grid, price at 362.25 holds just above the pivot point of 361.05. R1 at 363.48 and S1 at 359.82 bracket a tight, indecisive range.
15-Minute View: Consolidation Near Resistance
The 15-minute chart shows consolidation rather than directional conviction. Price at 362.25 is above the EMA20 at 361.51 but below both the EMA50 at 365.65 and EMA200 at 364.28. This mixed zone is typical of short-term chop following a sharp move.
Notably, the MACD histogram has ticked up to 0.77, even though the line at -2.32 remains below the signal at -3.09. This small early hint suggests downside momentum on the smallest timeframe may be losing steam. The RSI14 at 48.12 is essentially neutral.
Meanwhile, the Bollinger Bands on the 15m chart are tight. Price at 362.25 presses against the upper band of 362.10, with the mid at 359.85 and lower band at 357.60. That band-hugging behavior near resistance often precedes either a breakout attempt or a quick fade back toward the mid-band. On the pivot structure, price sits between the pivot at 361.31 and R1 at 363.22. Short-term traders are watching that resistance zone closely.
Bullish Scenario for Palo Alto Networks Stock
For Palo Alto Networks stock to resume its longer-term advance, bulls need to reclaim the daily EMA20 at 361.76 and hold above the pivot at 365.09. A push through R1 at 372.92 would open the path toward the Bollinger mid-band at 368.40. This would effectively repair the daily MACD’s negative histogram.
The fundamental case supports this path. Record RPO, expanding NGS ARR, platformization gains, and FY2027 revenue guidance of $14.1 billion to $14.2 billion all point to continued demand strength. CNBC also noted it was lifting its price target as AI-driven cyber demand intensifies. The CEO’s commentary on the scale of AI-driven cybersecurity spending — roughly $1 trillion in infrastructure still unprepared — reinforces the long-term outlook. If sentiment catches up with those fundamentals, the current pullback could prove shallow.
Bearish Scenario for Palo Alto Networks Stock
A failure to reclaim the EMA20 and a break below S1 at 354.27 would validate the bearish momentum showing up on both the daily and hourly MACD readings. In that case, the next meaningful support sits near the EMA50 at 339.67. That level would represent a much deeper retracement of the recent advance.
A sustained move below the 1H EMA200 at 359.12 would also serve as a warning sign. It would mark a break of the one moving average on the hourly chart that has so far held firm. Given the daily ATR14 at 18.92, moves of this magnitude are well within the current volatility regime.
Positioning and Volatility Outlook
Palo Alto Networks stock is caught between a resilient long-term trend and a short-term momentum fade. The fade followed a strong but seemingly under-rewarded earnings report. The daily chart’s bullish regime and wide distance from the EMA200 argue for patience with the broader trend.
At the same time, several factors argue for caution in the immediate term. These include the daily MACD’s bearish cross, the hourly chart’s momentum weakness, and the sheer size of the post-earnings range. With ATR readings elevated across timeframes, volatility itself is likely to remain the dominant feature in the sessions ahead. Positioning should account for that uncertainty rather than assume a clean resolution in either direction.
FAQ
Is Palo Alto Networks stock still in an uptrend after the post-earnings drop?
Yes, the daily trend remains bullish. Price at 362.09 sits well above the EMA50 at 339.67 and the EMA200 at 260.30. The daily regime reading is tagged bullish. However, short-term momentum has cooled, with the MACD showing a bearish cross and price sitting on the EMA20.
What are the key support levels for Palo Alto Networks stock?
The immediate support is S1 at 354.27, followed by the 1H EMA200 at 359.12. A break below those levels would target the EMA50 at 339.67, representing a much deeper retracement of the recent advance.
What did Palo Alto Networks report in its latest earnings?
The company reported record RPO, surging NGS ARR, and issued FY2027 revenue guidance of $14.1 billion to $14.2 billion. The CEO also highlighted that roughly $1 trillion in cybersecurity infrastructure remains unprepared for AI-driven threats, framing a long runway of demand.
What level would signal a bullish recovery for Palo Alto Networks stock?
Bulls need to reclaim the daily EMA20 at 361.76 and push above the pivot at 365.09. A move through R1 at 372.92 would open the path back toward the Bollinger mid-band at 368.40 and signal a decisive sentiment shift.
Disclaimer: This article is for informational purposes only and does not constitute financial advice, an investment recommendation, or a solicitation to buy or sell any financial instrument or cryptocurrency. The analysis provided is not indicative of future results. Investing in crypto assets and financial markets carries a high risk of capital loss. Always do your own research (DYOR) and consult a qualified financial advisor before making any decision.
Article produced with the assistance of artificial intelligence and reviewed by the editorial team.
