




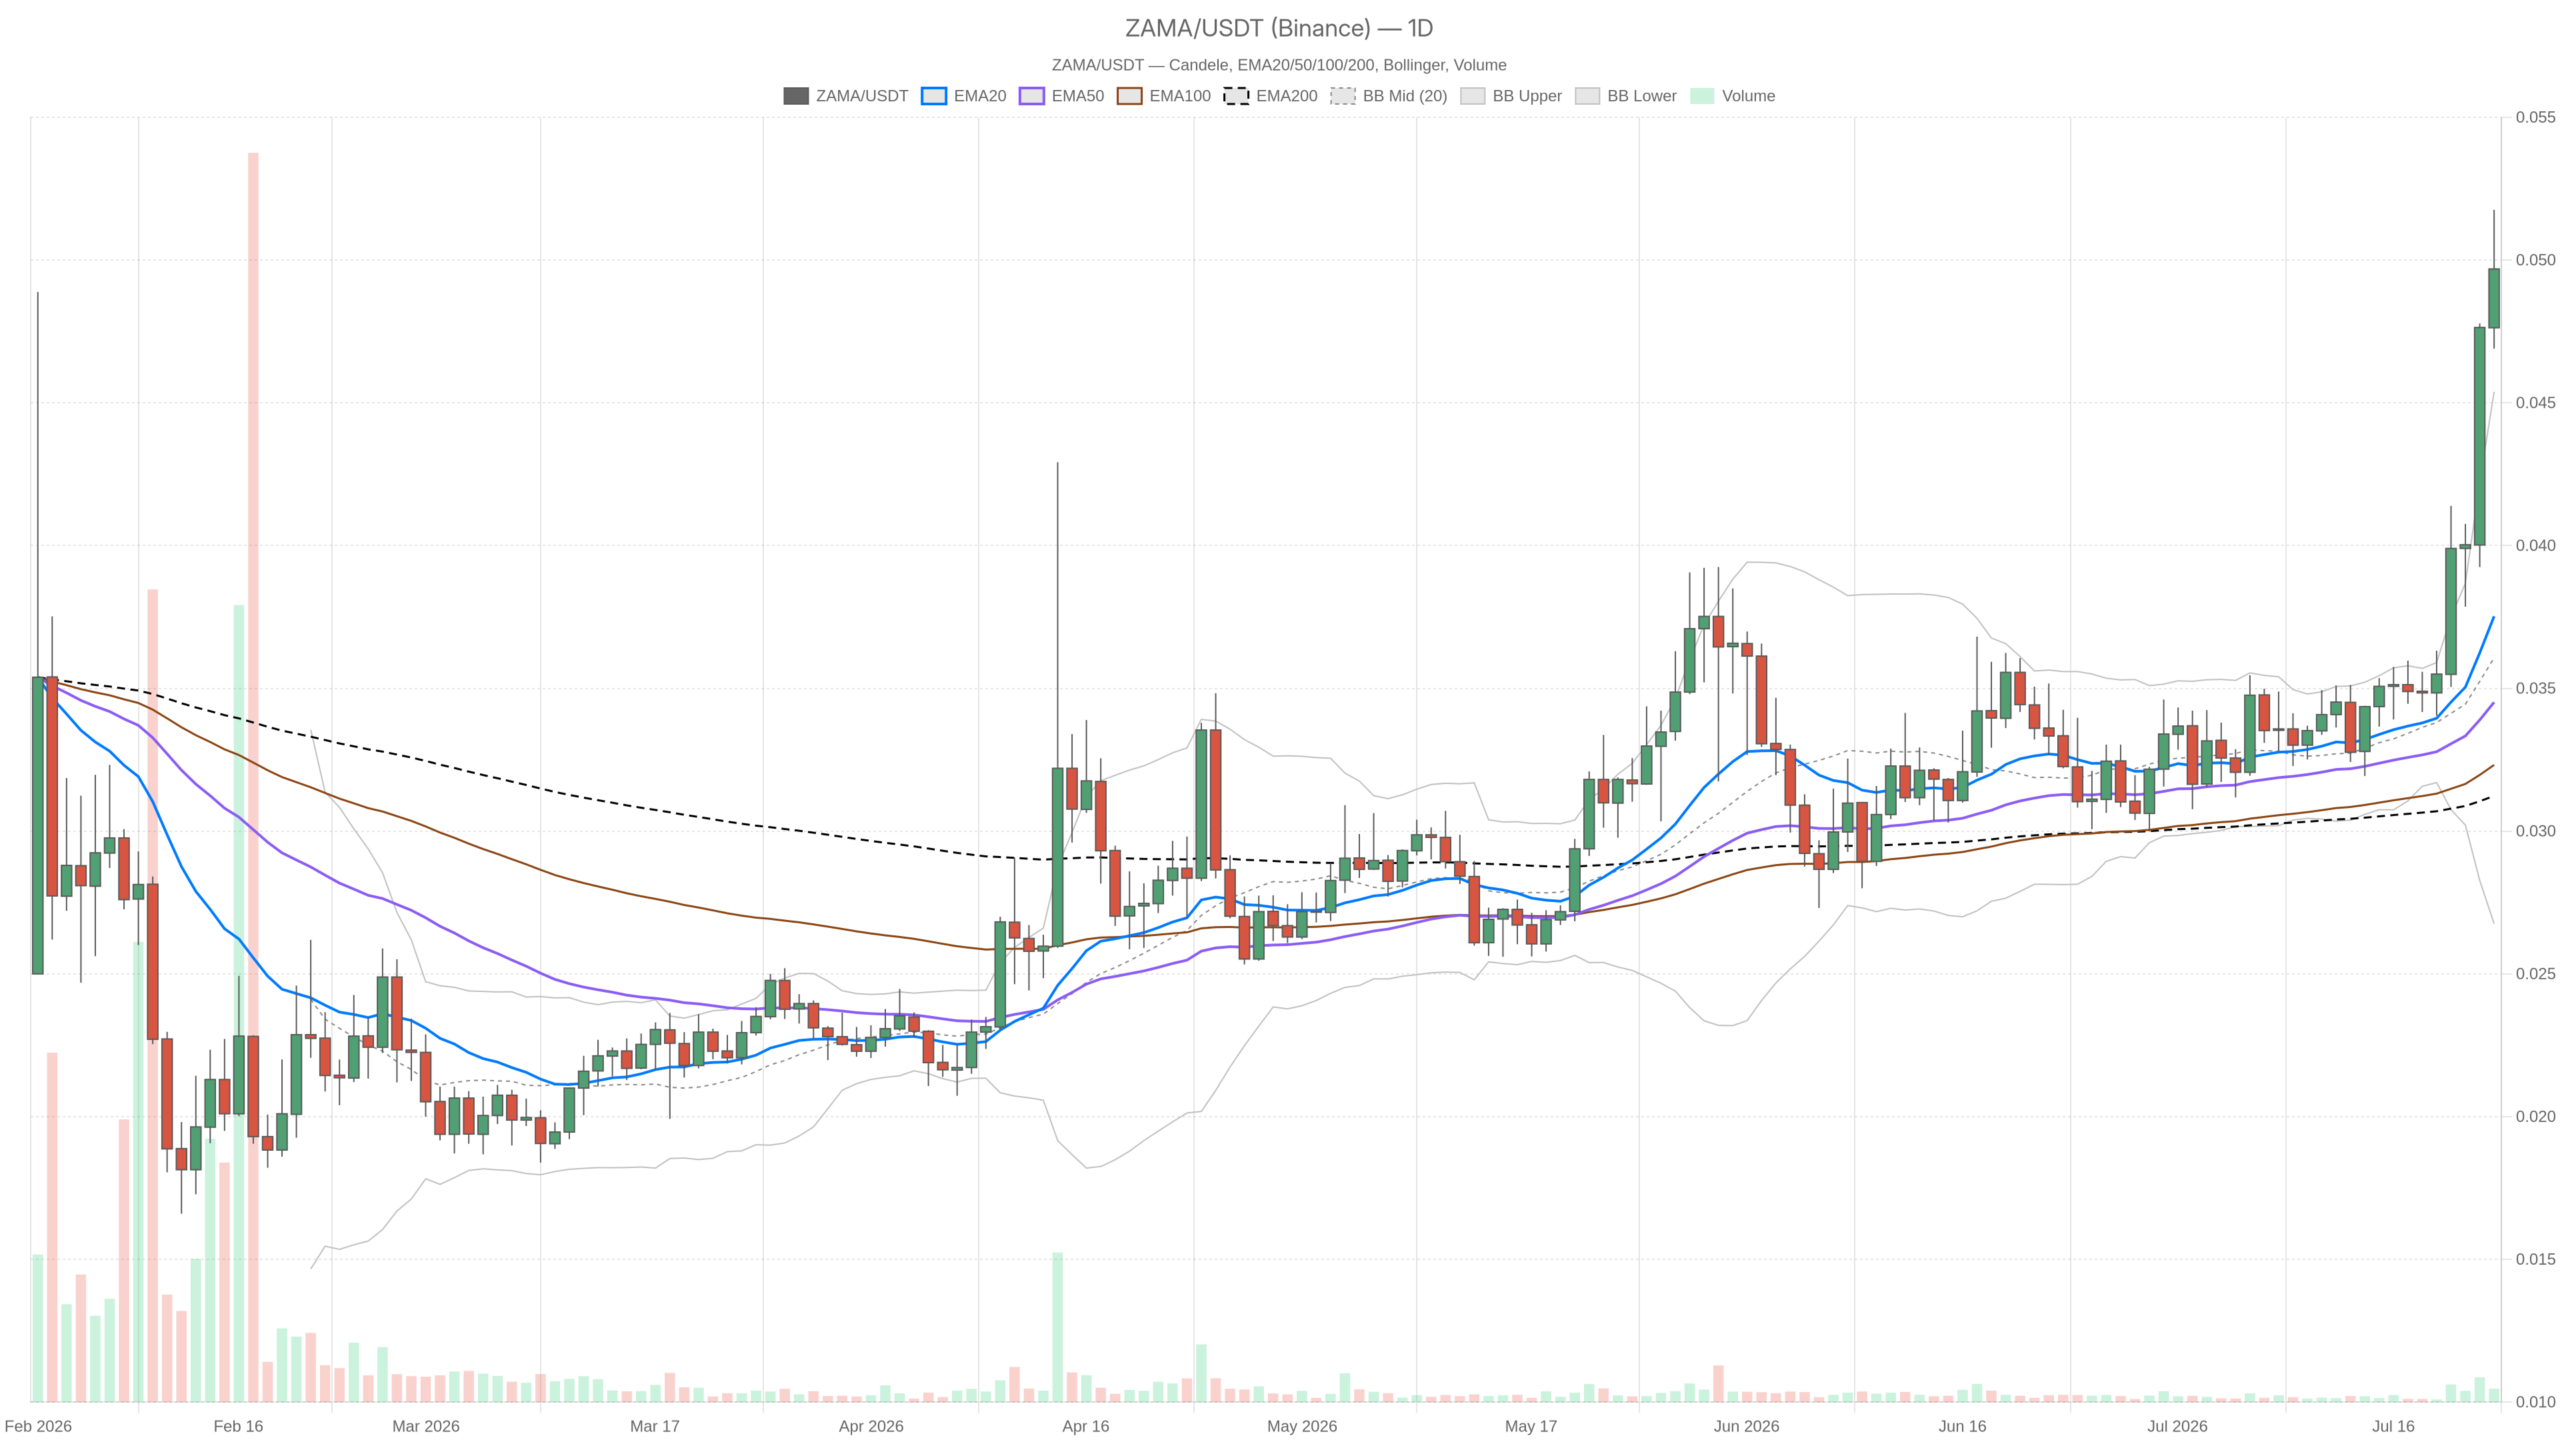
Market conditions are creating tension for traders of Zama crypto, which sits at $0.05 as of July 23, 2026. The daily RSI reading of 83.38 signals historically overbought territory, while the broader backdrop of fear and risk aversion complicates the outlook considerably.
Summary
Key takeaways
- The daily RSI for Zama has reached 83.38, a historically extreme level that typically precedes consolidation or a sharp reversal
- Price is hugging the upper Bollinger Band at $0.05, with roughly 40% downside to the midline at $0.04 if momentum stalls
- The broader crypto market sits in Fear territory with a Fear & Greed Index of 31 and Bitcoin dominance above 56.6%
- The EMA stack remains bullishly aligned across daily, hourly, and 15-minute timeframes
- A daily close below the EMA20 at $0.04 would be the first structural warning for the current uptrend
Daily Structure Shows a Bullish Trend Pushed to Extreme Levels
The daily timeframe reveals an undeniably bullish structure for Zama, with price trading above all three key exponential moving averages. The EMA20 sits at $0.04, the EMA50 at $0.03, and the EMA200 at $0.03 — a clean stack where short-term sits above medium-term and medium-term above long-term. This is the textbook definition of a trending market. However, the distance between current price and the EMA200 is substantial relative to the asset’s price range, meaning mean reversion risk is quietly building even if trend followers are not paying attention to it yet.
The daily RSI at 83.38 is the number that demands immediate attention. That is not merely overbought — it is historically extreme territory for most assets. Readings above 80 on the daily are rare, and when they occur, they typically precede either sharp consolidation or a violent reversal. The catch is timing: overbought conditions in trending markets can persist longer than most traders expect. Still, the RSI at 83 tells you the current move is powered by aggressive buying, and the margin for error on new long entries is thin and shrinking.
The Bollinger Bands on the daily confirm this picture. The midline sits at $0.04, with the upper band at $0.05 and the lower band at $0.03. Price is hugging the upper band, which in a strong uptrend is actually normal behavior — but it also means there is roughly 40% of downside to the midline if momentum stalls. Moreover, a close back inside the band with force would be the first structural warning shot for bulls. The pivot point, R1 and S1 all converge at $0.05, meaning the current price has very little pivot-level cushion before the structure opens up to lower levels.
Hourly Chart Reveals Cooling Momentum Beneath the Surface
The hourly timeframe shows momentum still present but definitely cooling. The hourly RSI sits at 69.54 — still elevated and technically approaching overbought, yet meaningfully lower than the daily reading. Price on this timeframe remains above the EMA20 at $0.05, the EMA50 at $0.04, and the EMA200 at $0.04, maintaining the bullish EMA structure. The Bollinger upper band at $0.05 and midline at $0.05 suggest compression is building at current price levels, which can resolve either through a breakout continuation or a snap back toward the lower band at $0.04.
The hourly RSI divergence from the daily is worth noting. It is not alarming on its own, but it signals that buying pressure at the intraday level is less aggressive than it was when the daily RSI started pushing toward 83. That said, when the shorter timeframe starts trailing off while the longer one remains pegged at extreme readings, it often marks the transition from pure trend-following conditions to a choppier, rotation-driven environment.
15-Minute Chart Signals Consolidation Before the Next Move
On the 15-minute chart, the RSI has settled to 54.03 — essentially neutral territory. All the EMA lines — the 20, 50, and 200 — have converged to $0.05, and the Bollinger Bands are extremely tight, with both upper and lower bands sitting at $0.05. This kind of compression at the 15-minute level is often a coiling mechanism: price consolidating after a strong move before the next directional push. The regime remains bullish here too, but the compressed structure means the next significant move on this timeframe could be sharp in either direction. For anyone thinking about execution timing, this is a moment for patience, not aggression.
Bullish and Bearish Scenarios: Two Diverging Paths
The bullish argument is straightforward. The EMA stack across all three timeframes is aligned, the daily regime is classified as bullish, and price is sustaining above the Bollinger midline on the daily. As long as Zama holds above the EMA20 on the daily at $0.04 on a closing basis, the path of least resistance remains upward. A sustained break and hold above $0.05 on the daily — confirmed by the hourly RSI recovering from its current 69 level and pushing through 75 with volume — would suggest the next leg of the trend is underway.
The bearish argument does not need a catastrophe to materialize — just gravity. A daily RSI above 83 combined with price at the Bollinger upper band and a broader market Fear & Greed reading of 31 is a setup where a correction needs no external catalyst. If Zama were to close back below the EMA20 at $0.04, that would be the first meaningful warning that the trend is losing its footing. Should price then undercut the EMA50 at $0.03, the bullish thesis would be in serious trouble. The invalidation of the bullish case is a failed hold of the EMA20 on the daily accompanied by an RSI rollover below 70.
Positioning Strategy Amid Conflicting Signals
Zama crypto is in a technically strong uptrend — that is the honest assessment. However, trading a daily RSI of 83.38 on the long side, against a backdrop of broad market fear and Bitcoin dominance above 56%, is a risk management exercise as much as a directional call. The market structure supports bulls on paper, yet the macro environment reflects defensive positioning rather than risk appetite. That disconnect rarely resolves painlessly for late-trend chasers.
Anyone already long with a strong entry should consider where to take profits or tighten stops — the EMA20 at $0.04 is a logical reference point. Anyone considering a fresh entry should weigh whether the risk-reward at $0.05, with the upper Bollinger Band as a ceiling and an RSI reading that leaves little room for further expansion, justifies exposure. Volatility at compressed Bollinger levels on the 15-minute chart tends to be underestimated right before it becomes impossible to ignore. This is not a call to action in either direction; it is a map of the terrain as it stands on July 23, 2026 — and the terrain has sharp edges on both sides.
FAQ
What does an RSI of 83.38 mean for Zama crypto?
An RSI reading of 83.38 on the daily chart places Zama in historically overbought territory. Readings above 80 are rare and typically precede either consolidation or a sharp reversal. However, in strong trending markets, overbought conditions can persist, so timing the turn remains challenging.
Where are the key support levels for Zama right now?
The most immediate and critical support is the daily EMA20 at $0.04. Below that, the EMA50 and EMA200 both sit at $0.03. A daily close below $0.04 would be the first structural warning that the uptrend is weakening.
How does the broader market context affect Zama’s outlook?
The broader crypto market is in Fear territory with a Fear & Greed Index of 31 and Bitcoin dominance above 56.6%. Total market capitalization stands at approximately $2.325 trillion according to CoinGecko. This environment of defensive positioning and risk aversion creates headwinds for any token attempting to sustain an aggressive rally.
Disclaimer: This article is for informational purposes only and does not constitute financial advice, an investment recommendation, or a solicitation to buy or sell any financial instrument or cryptocurrency. The analysis provided is not indicative of future results. Investing in crypto assets and financial markets carries a high risk of capital loss. Always do your own research (DYOR) and consult a qualified financial advisor before making any decision.
Article produced with the assistance of artificial intelligence and reviewed by the editorial team.
