




Visa stock closed at 368.54 on August 5, holding above key daily EMAs in a well-established uptrend. However, momentum is cooling as price tests the upper Bollinger Band near 373.34 and the daily MACD histogram turns slightly negative—an early pause signal, not a reversal.
Summary
Key takeaways
- Visa stock closed at 368.54 on August 5, above the 20-, 50-, and 200-day EMAs.
- The daily RSI14 at 64.24 remains bullish but not overbought, leaving room for further upside.
- Daily MACD histogram turned slightly negative at -0.02, signaling momentum cooling across timeframes.
- Price tested the upper Bollinger Band at 373.34, a zone where buyers often hesitate.
- The 15-minute chart shows fully neutral conditions, with RSI14 at 49.51 and very low volatility.
Visa Stock Daily Technical Structure
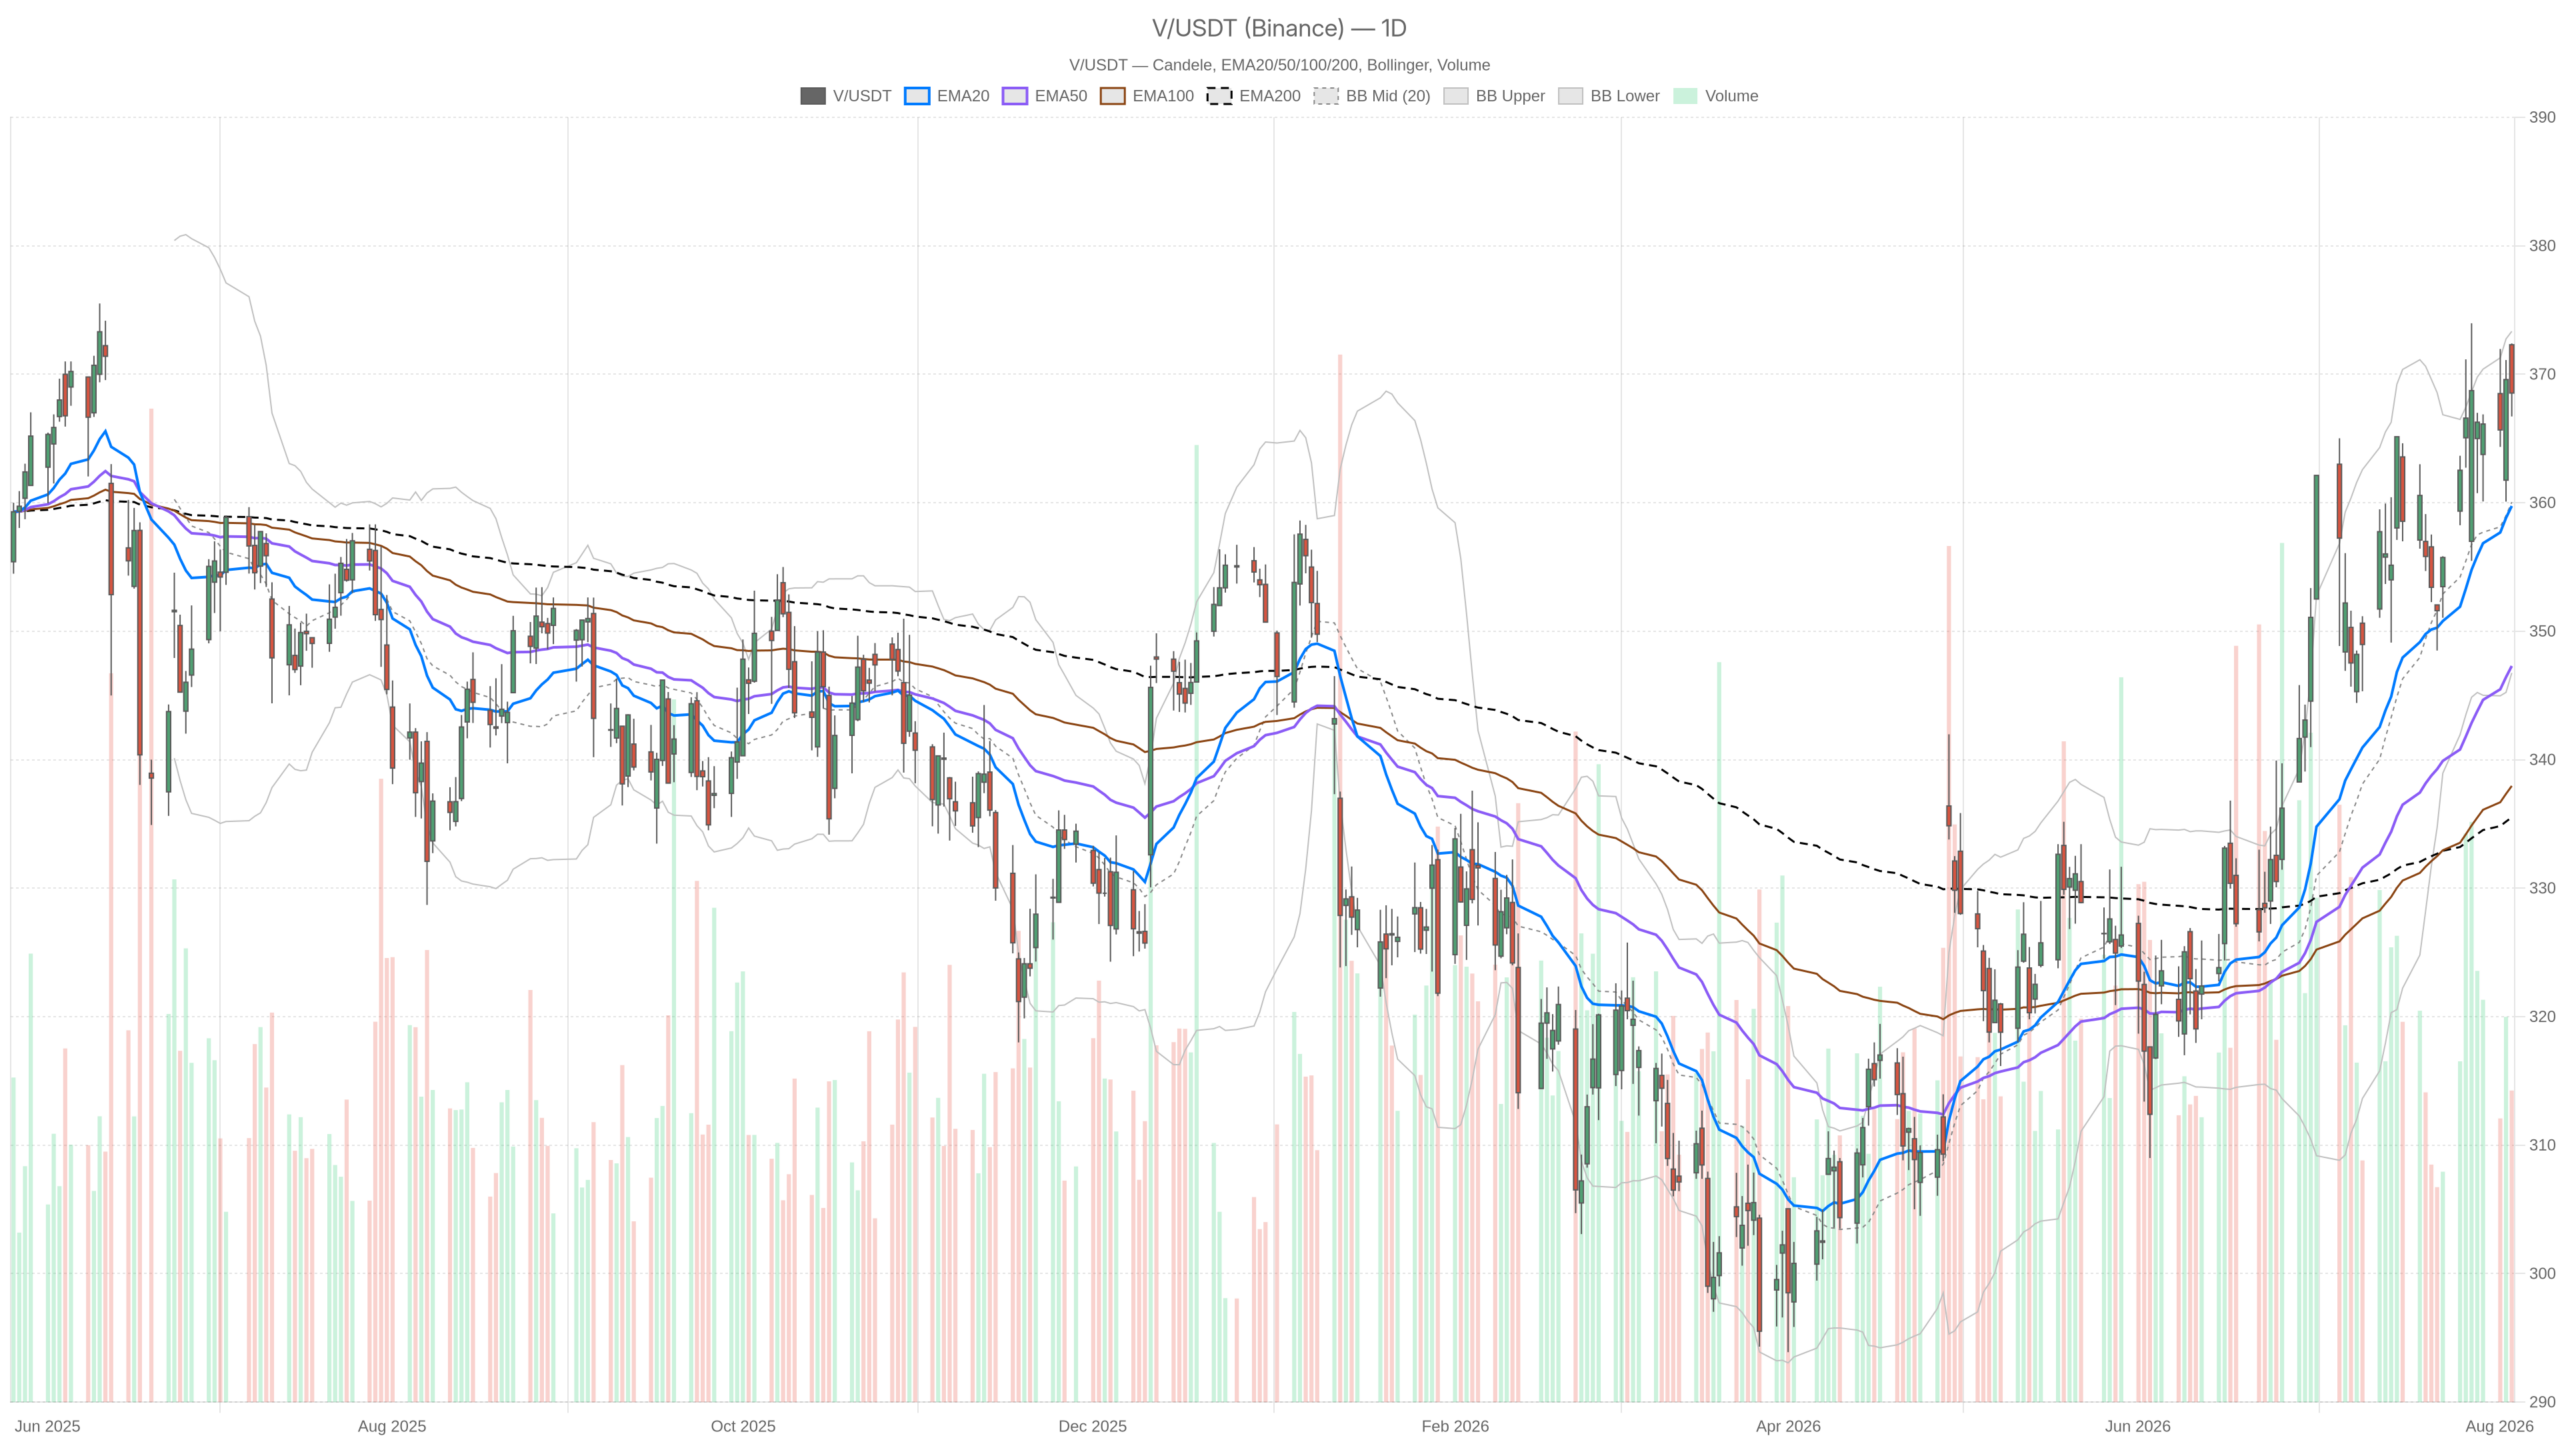
The daily chart shows Visa stock in a firmly bullish trend, with price holding above all major moving averages. Price closed at 368.54 on August 5, comfortably above the 20-, 50-, and 200-day EMAs at 359.75, 347.30, and 335.52 respectively. This alignment confirms a healthy, well-established uptrend.
However, the session also printed a high of 372.40, brushing against the upper Bollinger Band at 373.34. This suggests the rally has stretched into an area where buyers historically start to hesitate.
Meanwhile, the daily RSI14 sits at 64.24, still bullish but nowhere near overbought territory. That leaves room for further upside without immediately flashing exhaustion. At the same time, the daily MACD tells a more nuanced story: the line at 7.01 is now just below the signal at 7.03, producing a slightly negative histogram of -0.02.
In practice, this is an early momentum warning, not a reversal signal. It simply means the pace of the advance is cooling. This is happening right as price tests resistance near the daily pivot’s R1 at 371.72 and the upper Bollinger Band.
Hourly Confirmation and Short-Term Momentum
The hourly chart largely confirms the daily bullish regime. Price at 368.38 sits above the 20-, 50-, and 200-period EMAs at 367.76, 365.93, and 355.50. Structurally, that keeps the short-term trend intact.
However, the hourly RSI14 has pulled back to 54, a more neutral reading. It reflects the same loss of thrust visible on the daily chart. The hourly MACD histogram is also negative, at -0.11. This reinforces that momentum is fading in step across both timeframes rather than diverging.
Notably, price is hovering around the hourly pivot point at 368.44. It is trapped in a narrow band between support at 367.74 (S1) and resistance at 369.07 (R1). This is a classic sign of indecision after a strong run. The market now looks like it is digesting recent gains rather than extending them immediately.
Intraday Execution Landscape
The 15-minute chart reflects a neutral, low-volatility environment suited for positioning rather than directional bets. Its regime reading is labeled neutral, with the RSI14 parked at 49.51. Meanwhile, the MACD line and signal are essentially flat at 0.01 and 0.00.
Price is pinned almost exactly to the 15-minute pivot at 368.55. A tiny ATR14 of just 0.62 highlights how compressed intraday volatility has become. Overall, traders should treat this as a pause for positioning, since the larger trend decision still rests with the daily and hourly structure.
Bullish Scenario for Visa Stock
Bulls need price to hold above 366.04 and break through 371.72 to extend the rally toward the upper Bollinger Band. The bullish case hinges on the daily uptrend absorbing the current momentum pause without breaking structure. Holding above the hourly EMA20 near 367.76 and the daily pivot support at 366.04 would keep buyers in control.
A subsequent break above the daily R1 at 371.72 and the recent high of 372.40 would reopen the path upward. Notably, sentiment received a boost on August 3. Visa stock rose after the company announced it is acquiring BioCatch in a $2.4 billion cybersecurity deal. The acquisition targets account-takeover fraud, a move the market read as strategically positive.
Bearish Scenario for Visa Stock
The bearish case would activate if price loses the 366.04 daily support and the hourly 50-EMA at 365.93 in tandem. That combination would confirm the current momentum softness is more than just a pause. The negative MACD histograms on both the daily and hourly charts mean this risk should not be dismissed. The broader trend structure, however, remains intact for now.
Separately, Visa drew negative headlines on August 5. Reports indicated the company cut 2,600 jobs, including senior executives at its California offices. While this is a corporate development rather than a technical signal, it adds a layer of headline risk. Sentiment could weaken if the market interprets the cuts as a sign of internal cost pressure rather than disciplined restructuring.
Outlook and Key Levels for Visa Stock
Visa stock is caught between a still-intact daily uptrend and a momentum profile that is clearly cooling. The 15-minute chart’s neutral, low-volatility posture suggests the market is waiting for a catalyst rather than committing to a direction.
Near-term price action is likely to remain sensitive to technical triggers and corporate news flow. This reflects the tight range between key pivot levels and the proximity to the upper Bollinger Band. Positioning around these levels should therefore account for elevated uncertainty. The market must still resolve whether this is a healthy pause or the start of a deeper pullback.
FAQ
Is Visa stock still in a bullish trend?
Yes. Visa stock closed at 368.54 on August 5, above the 20-, 50-, and 200-day EMAs, confirming a well-established daily uptrend. The daily RSI14 at 64.24 also supports the bullish structure without signaling overbought conditions.
What signals suggest Visa stock’s momentum is cooling?
The daily MACD histogram turned slightly negative at -0.02, with the MACD line at 7.01 slipping just below the signal at 7.03. The hourly MACD histogram is also negative at -0.11. Both timeframes show fading momentum without a clear reversal signal.
What are the key technical levels to watch for Visa stock?
Support sits at 366.04 (daily pivot) and 365.93 (hourly 50-EMA). Resistance stands at 371.72 (daily R1) and 373.34 (upper Bollinger Band). A break of either zone could determine the next directional move.
What recent corporate developments could affect Visa stock?
Visa announced the acquisition of BioCatch for $2.4 billion on August 3, a cybersecurity deal targeting account-takeover fraud that the market read positively. On August 5, reports emerged that Visa cut 2,600 jobs, including senior executives. Both developments add sentiment risk alongside the technical picture.
Disclaimer: This article is for informational purposes only and does not constitute financial advice, an investment recommendation, or a solicitation to buy or sell any financial instrument or cryptocurrency. The analysis provided is not indicative of future results. Investing in crypto assets and financial markets carries a high risk of capital loss. Always do your own research (DYOR) and consult a qualified financial advisor before making any decision.
Article produced with the assistance of artificial intelligence and reviewed by the editorial team.
