



Bloom Energy stock closed the daily session at $217.45, caught between two conflicting chart messages. The higher timeframe remains corrective, while lower timeframes show buyers back in control. This tension defines BE right now, at a moment when headline flow around the name has rarely been louder.
Summary
Key takeaways
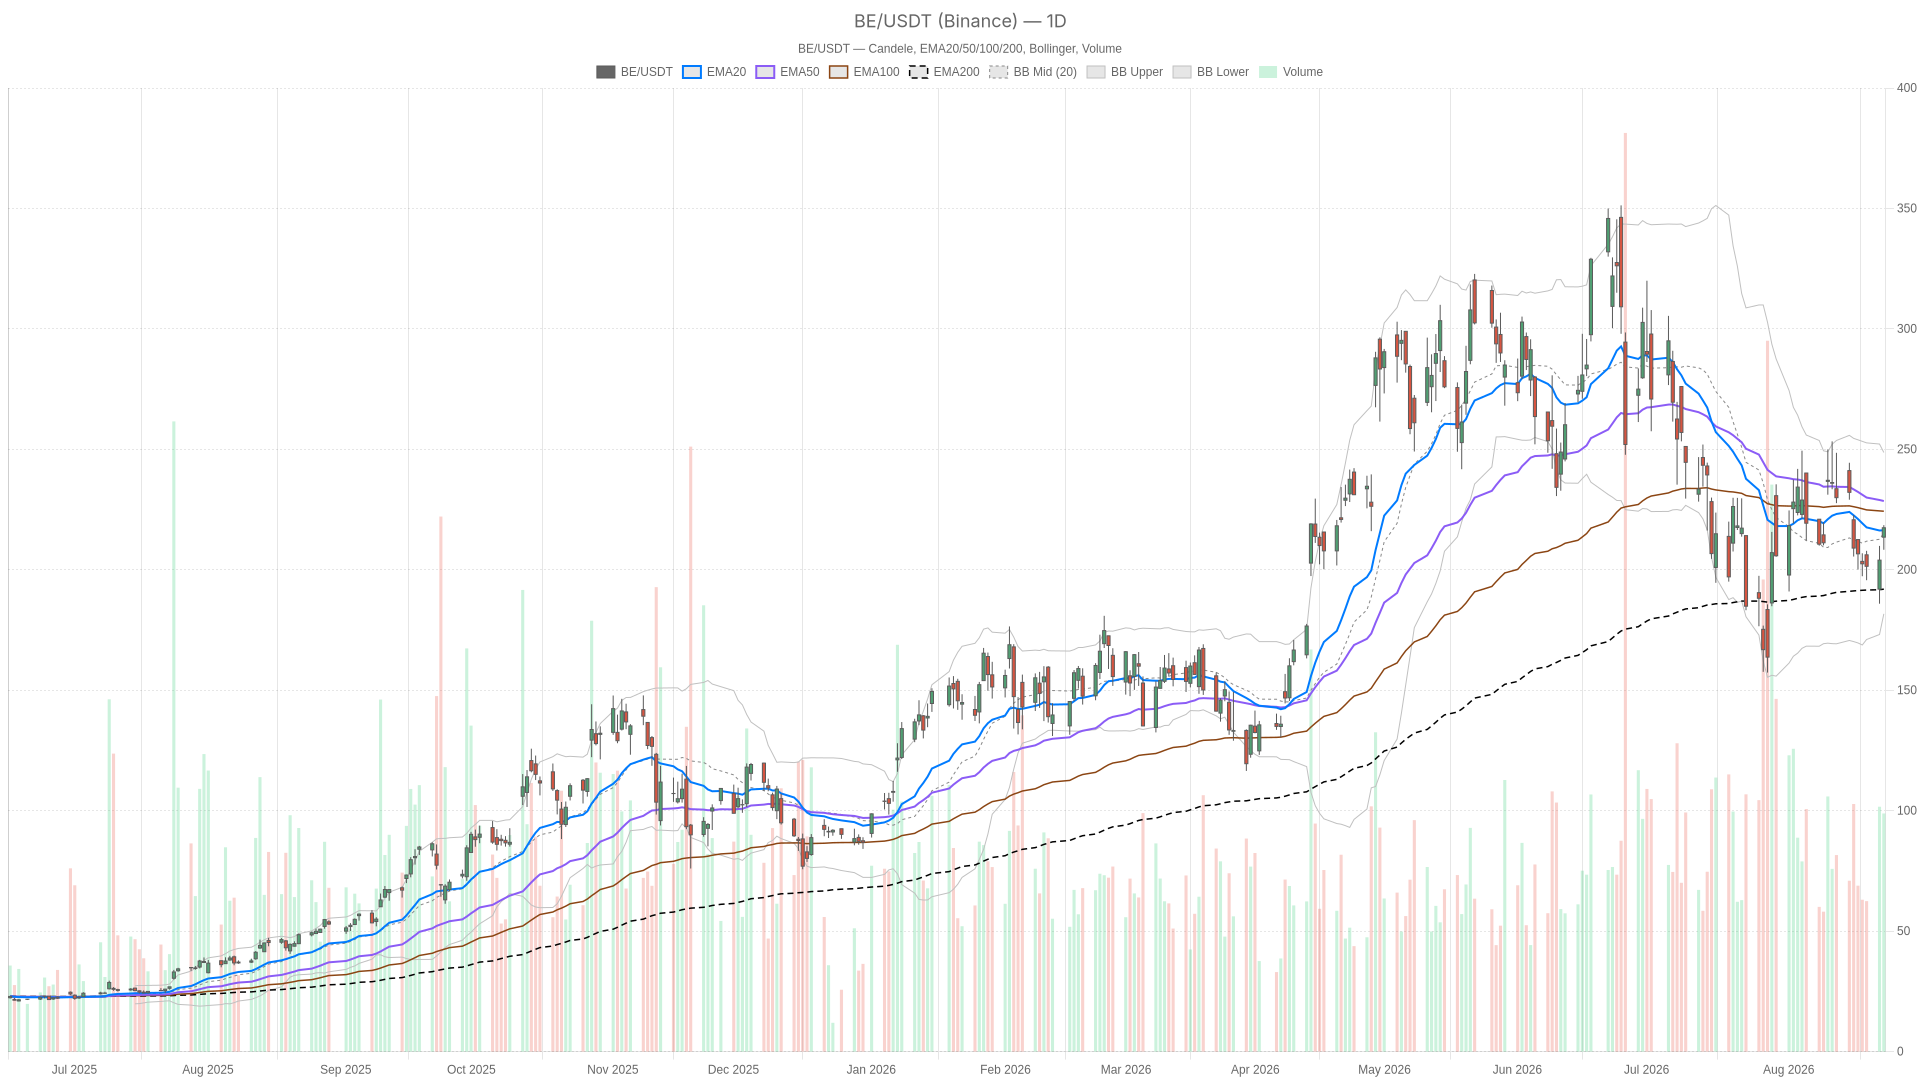
- Bloom Energy stock closed at $217.45, above the daily 20-EMA at 216.42 but below the 50-EMA at 228.52.
- Daily RSI14 sits at 49.09, while the daily MACD histogram has just turned positive at 0.42.
- Hourly RSI14 has climbed to 64.06, confirming stronger short-term buyer momentum.
- The company reset its 2026 guidance to $4.05 billion as revenue accelerates.
- A daily close above 221.21 or below 211 likely matters more than any single intraday move.
Daily Structure: Where Bloom Energy Stock Stands
The daily chart still frames Bloom Energy stock as corrective rather than confirmed bullish. Price sits above the 20-period EMA at 216.42 but well below the 50-period EMA at 228.52. Meanwhile, the 200-period EMA sits far lower at 191.98. That keeps the broader trend technically constructive even though the intermediate structure is not.
Still, this is a classic pullback-and-recovery setup. The stock fell from higher levels and is now trying to rebuild momentum underneath a resistance zone it hasn’t reclaimed yet. RSI14 at 49.09 reflects that indecision almost perfectly. It is neither overbought nor oversold.
The daily MACD tells a similar story. The line is at -5.8, the signal at -6.22, and the histogram has just turned positive at 0.42. In practical terms, downside momentum is fading, but it hasn’t flipped into a confirmed bullish trend yet.
Volatility Context and Daily Pivots
Volatility context matters here too. The Bollinger Bands are wide, with the mid-line at 215.21, the upper band at 248.69, and the lower band at 181.72. ATR14 sits at 19.36, which is a large daily range for this stock. Therefore, whichever direction the daily trend resolves in, moves are likely to be sharp rather than gradual.
Daily pivot levels frame the near-term battle zone clearly: pivot at 214.77, resistance at 221.21, and support at 211.
Hourly Momentum: Buyers Take Control of BE
The hourly chart gives a decisively more bullish short-term picture for Bloom Energy stock. Price at 217.58 is trading above both the 20-EMA at 210.07 and the 50-EMA at 211.13. However, the 200-EMA sits higher at 222.69, meaning the broader hourly trend still leans bearish beneath the surface.
RSI14 on the 1H chart has climbed to 64.06. That confirms momentum has shifted firmly in favor of buyers over recent sessions. The MACD line at 2.83 sits comfortably above its signal line at 0.89, with a histogram of 1.94, a clean bullish reading.
Bollinger Bands on this timeframe show price pushing toward the upper band at 221.56, with the mid-line at 206.9. That underscores how strong this short-term push has been. Hourly pivots put resistance at 218.81 and support at 215.81. Both levels will likely stay in focus into the next session.
15-Minute Execution: Consolidation Near the Highs
On the 15-minute chart, the answer is explicitly bullish for BE. The EMA stack confirms it. The 20-EMA at 215.5 sits above the 50-EMA at 211.35, which sits above the 200-EMA at 211.18. That is a textbook bullish alignment for a short-term trend.
RSI14 at 65.11 shows momentum still tilted toward buyers, though it is edging toward stretched territory. Notably, the MACD histogram has slipped slightly negative at -0.34, even though the MACD line at 1.96 remains above zero. This suggests short-term momentum is cooling into consolidation rather than reversing outright.
Bollinger Bands are tight, with price hugging the upper band at 218.01 against a mid-line of 216.38. ATR14 has compressed to just 1.47. In other words, the intraday range has narrowed considerably after the recent push higher, a typical pause before the next directional move.
News Flow: A Crowded Backdrop for Bloom Energy Stock
The news backdrop is eventful and directly relevant to Bloom Energy stock. The company reset its 2026 guidance to $4.05 billion as revenue accelerates. That prompted at least one long-time bullish voice on Seeking Alpha to turn neutral after acknowledging they underestimated how fast the business is scaling.
At the same time, a separate Yahoo Finance piece raised the question of peer-group mispricing. It noted that Bloom is already priced at the richest multiple in its comparison group despite posting elite growth.
Meanwhile, political disclosure headlines have added another layer. Reports indicate that former House Speaker Nancy Pelosi’s household disclosed a substantial new position in Bloom Energy. The purchase came shortly after a short-seller report targeted the company. It also came just ahead of its best quarter on record, accompanied by raised full-year guidance.
Shares reportedly jumped 5.5% intraday on the morning the disclosure became public. This kind of headline-driven demand can accelerate a technical move, but it also introduces flow that isn’t purely fundamental or technical in nature.
Bullish Scenario: Reclaiming the Daily 50-EMA
The bullish case builds on what the hourly and 15-minute charts are already showing. A sustained close above the daily resistance at 221.21 would be the first real signal that the corrective structure is breaking down in favor of buyers.
From there, a reclaim of the daily 50-EMA at 228.52 would confirm the shift. That would effectively erase the overhead resistance that has capped the stock since the pullback began. Continued strength in daily RSI above the 50 mark would reinforce the recovery.
A daily MACD histogram that keeps expanding higher would add further confirmation. The fundamental backdrop, namely accelerating revenue and raised guidance, gives this scenario a credible narrative beyond pure chart mechanics.
Bearish Scenario: A Fading Bounce
The bearish case rests on the daily chart’s unresolved weakness. A rejection near the daily EMA50 zone would suggest the current bounce is running out of fuel. The same applies to a failure to hold above the 216.42 EMA20 and the 211 pivot support.
In contrast, the daily MACD line remains negative at -5.8. If the histogram rolls back over rather than continuing to expand, that would be an early warning sign. Valuation concerns raised in the peer-group mispricing discussion could also become a catalyst for profit-taking.
The already-cooling MACD histogram on the 15-minute chart hints that short-term momentum may need a fresh trigger. Without one, a pullback toward daily support near 211 becomes a real possibility.
Closing Take: Two-Way Risk at an Inflection Point
Overall, Bloom Energy stock sits at a genuine inflection point. The daily trend remains neutral and corrective, still capped below its 50-EMA. Meanwhile, the hourly and 15-minute timeframes show buyers firmly in control of the near-term tape.
That divergence, combined with a daily ATR of 19.36, means volatility is likely to stay elevated regardless of which side wins out. Positioning around current levels therefore carries real two-way risk. Headline-driven flow adds an extra layer of unpredictability.
Confirmation from the daily chart above 221.21 or below 211 will likely matter more than any single intraday move. This analysis is provided for informational purposes and does not constitute financial advice.
FAQ
Is Bloom Energy stock in a bullish or bearish trend?
The daily trend remains corrective and neutral. Bloom Energy stock trades above its 20-period EMA at 216.42 but below its 50-period EMA at 228.52, while lower timeframes show stronger short-term buying momentum.
What are the key levels to watch for BE?
Daily resistance sits at 221.21, with the 50-EMA at 228.52 acting as a broader ceiling. Daily support sits at 211, with the daily pivot at 214.77 framing the near-term battle zone.
Why did Bloom Energy stock jump 5.5% intraday?
Reports indicated that former House Speaker Nancy Pelosi’s household disclosed a substantial new position in Bloom Energy. Shares reportedly jumped 5.5% intraday on the morning the disclosure became public.
What is Bloom Energy’s 2026 guidance?
The company reset its 2026 guidance to $4.05 billion as revenue accelerates.
Disclaimer: This article is for informational purposes only and does not constitute financial advice, an investment recommendation, or a solicitation to buy or sell any financial instrument or cryptocurrency. The analysis provided is not indicative of future results. Investing in crypto assets and financial markets carries a high risk of capital loss. Always do your own research (DYOR) and consult a qualified financial advisor before making any decision.
Article produced with the assistance of artificial intelligence and reviewed by the editorial team.
