




Cango stock (CANG) came under heavy pressure after a rough Q2 2026 earnings release. On September 1, price opened at 2.07 and collapsed to close at 1.84, an 11% loss. The technical picture has been deteriorating for months, setting a bearish tone for the sessions ahead.
Summary
Key takeaways
- Cango stock fell roughly 11% on September 1, closing at 1.84 after a painful Q2 2026 earnings miss.
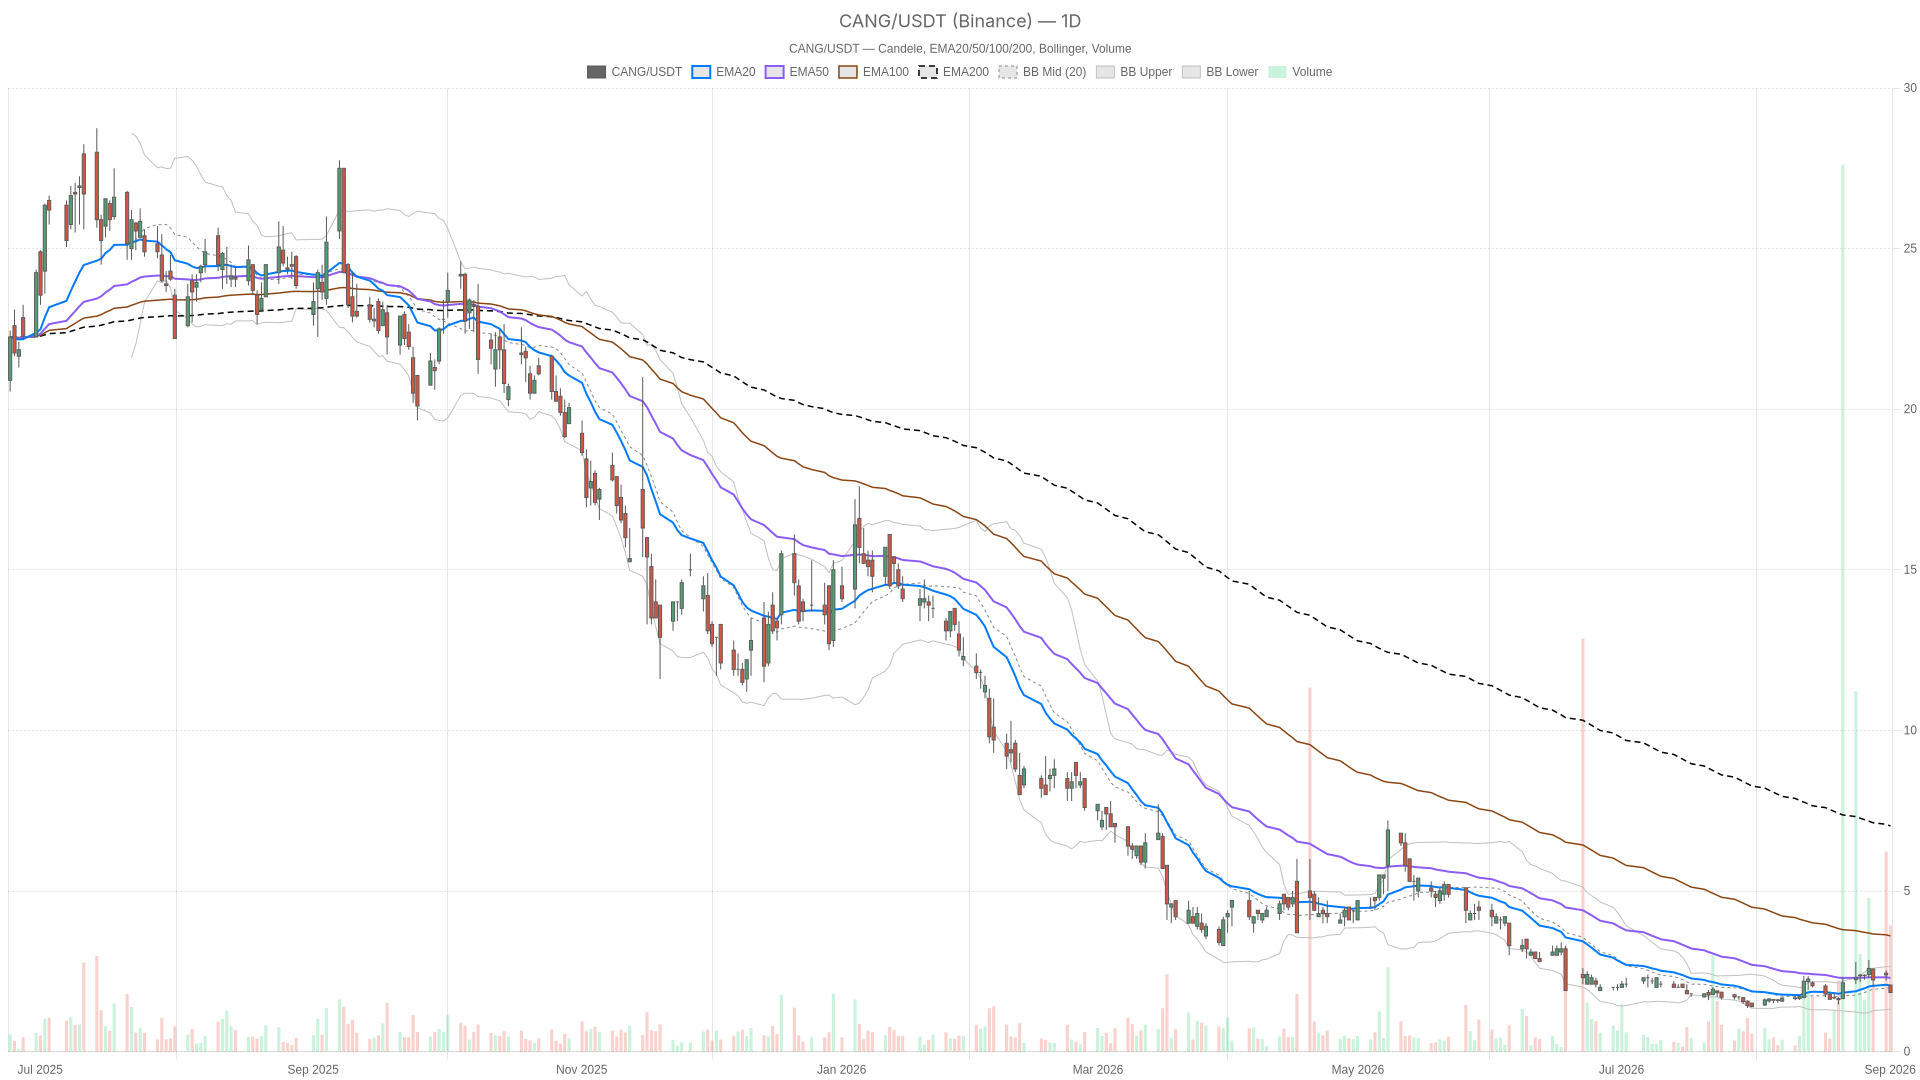
- The daily chart shows a structural downtrend, with price trading below the EMA20 at 2.06, EMA50 at 2.29, and EMA200 at 7.02.
- A confluence support zone has formed between 1.81 and 1.82, aligning 15-minute and hourly pivot levels.
- The bearish scenario targets a move toward the lower daily Bollinger Band at 1.33 if support at 1.75 breaks.
- Oversold RSI on the 15-minute chart and a mildly positive daily MACD histogram hint at a possible short-term bounce.
Daily Timeframe: The Bearish Backbone
The daily chart paints a decisively bearish picture for Cango stock, with price entrenched below all key moving averages and room for further downside.
Trend Structure and Moving Averages
Notably, the daily regime reading is flagged outright as bearish. Price at 1.84 sits below the EMA20 at 2.06 and well below the EMA50 at 2.29. More striking is the EMA200 at 7.02. That level sits so far above current price it underscores how deep the structural downtrend has become. This is not a shallow pullback. It is a multi-month trend breakdown.
Momentum and MACD Signals
Meanwhile, the daily RSI14 reads 45.6. Despite the sharp drop, it has not reached oversold territory. That leaves room for further downside before the market becomes technically stretched. The daily MACD tells a slightly different story. The MACD line sits at 0.08 against a signal of 0.04, with a positive histogram of 0.04. This mild bullish divergence hints that downside momentum may be losing steam. Still, the broader trend remains negative.
Bands and Pivot Levels
Bollinger Bands show a mid-line at 1.98, with price closing below it at 1.84. The daily ATR14 of 0.39 is elevated, signaling that volatility has spiked following the earnings shock. Pivot levels frame the near-term battle: pivot at 1.91, resistance at 2.00, and support at 1.75. Closing below the pivot keeps sellers in control heading into the next session.
1H Timeframe: Confirmation With a Layer of Complexity
The hourly chart largely confirms the daily bearish bias, though a neutral regime tag adds a layer of complexity traders should not ignore.
EMA Stack and Trend Alignment
On the hourly frame, price at 1.83 is trading below all three EMAs. The EMA20 sits at 2.11, EMA50 at 2.17, and EMA200 at 2.01. This is a fully bearish EMA stack, even if the neutral regime label does not fully reflect it.
Momentum, Volatility and Pivot Context
At the same time, RSI14 on the hourly chart sits at 34.84. It is approaching oversold conditions but not quite there yet. The MACD is unambiguously negative. The line reads -0.13, signal at -0.08, and histogram at -0.05. That widening negative histogram suggests downside momentum is still building. This contrasts with the milder daily MACD reading. Bollinger Bands show price closer to the lower band at 1.70 than to the mid-line at 2.15. The hourly ATR14 of 0.16 confirms volatility remains active. Pivot levels are tight: pivot at 1.84, resistance at 1.86, support at 1.81. Current price sits almost exactly at the pivot line, a genuine tug-of-war zone.
15-Minute Execution Context
The 15-minute chart shows early signs of short-term exhaustion within an ongoing bearish structure, creating potential for a tactical bounce.
Zooming into the 15-minute chart, the regime reads bearish again. However, there are early signs of short-term exhaustion. RSI14 has dropped to 31.1, firmly into oversold territory. The MACD histogram has flipped slightly positive at 0.01. Notably, the MACD line at -0.07 remains below the signal at -0.08. This is a subtle but real detail: momentum may be pausing for a bounce, even within a broader downtrend.
Meanwhile, price is hugging the lower Bollinger Band at 1.82. The mid-line sits at 1.87 and the upper band at 1.92. The EMA stack remains bearish, with EMA20 at 1.90, EMA50 at 2.05, and EMA200 at 2.17. All sit above current price. Pivot support at 1.82 lines up closely with the hourly support at 1.81. This creates a short-term confluence zone that traders monitoring Cango stock will be watching closely.
Bullish Scenario for Cango Stock
A bullish reversal would require Cango stock to first defend the 1.81–1.82 confluence zone and then reclaim key hourly moving averages.
Specifically, the bullish case starts with defense of the confluence support zone between 1.81 and 1.82. That is where the 15-minute and hourly pivots align. If buyers step in there, a reclaim of the hourly EMA20 at 2.11 would be the first meaningful signal. The daily MACD histogram, already mildly positive, would need to translate into a similar turn on lower timeframes. A push back above the daily pivot at 1.91 would confirm the sell-off was overextended. Resistance at 2.00 marks the next upside test.
Bearish Scenario for Cango Stock
The bearish scenario appears structurally better supported, with the Q2 2026 earnings miss providing a clear fundamental catalyst for further downside.
In contrast, the bearish case looks structurally more convincing. The Q2 2026 earnings miss saw revenue fall short and the company swing to an $81.6 million loss. That gives sellers a clear catalyst. A break below daily support at 1.75 would open the door toward the lower daily Bollinger Band at 1.33. That move is wider than current volatility suggests but not unreasonable given the ATR14 of 0.39. Failure to hold the 1.81–1.82 confluence zone would likely accelerate the decline. This is especially true if the hourly MACD histogram continues to widen negatively.
Closing Thoughts
Cango stock remains technically fragile. The bearish daily trend is reinforced by both the wide EMA200 gap and the fundamental weight of the Q2 earnings miss.
Overall, Cango stock holds a fragile technical posture. The daily trend is bearish. The EMA200 gap highlights a deep structural downtrend. The recent earnings miss adds fundamental weight to the selling pressure. However, oversold RSI readings on the 15-minute chart introduce some nuance. A mildly positive daily MACD histogram adds to this complexity. Together, they suggest the drop may pause for a technical bounce. This could happen even if the broader trend stays negative. Given elevated ATR readings across timeframes, volatility is likely to remain the defining feature. Positioning around the 1.81–1.82 support cluster will be the key tell for where Cango stock moves next.
FAQ
Why did Cango stock drop sharply on September 1?
Cango stock fell roughly 11% after the company reported disappointing Q2 2026 earnings. Revenue missed estimates and the company swung to an $81.6 million loss, triggering heavy selling pressure.
What is the key support level for Cango stock right now?
A confluence support zone has formed between 1.81 and 1.82, where 15-minute and hourly pivot levels align. Below that, the next major support sits at 1.75, followed by the lower daily Bollinger Band at 1.33.
Is there any sign of a potential bounce in Cango stock?
Yes, the 15-minute RSI has dropped to 31.1 into oversold territory. The MACD histogram on that timeframe has turned slightly positive. Combined with a mildly positive daily MACD histogram, these signals hint at a possible short-term bounce. However, the broader trend remains bearish.
What is the bearish price target for Cango stock?
If Cango stock breaks below daily support at 1.75, the next downside target is the lower daily Bollinger Band at 1.33. This target is consistent with the elevated daily ATR14 reading of 0.39 following the earnings shock.
Disclaimer: This article is for informational purposes only and does not constitute financial advice, an investment recommendation, or a solicitation to buy or sell any financial instrument or cryptocurrency. The analysis provided is not indicative of future results. Investing in crypto assets and financial markets carries a high risk of capital loss. Always do your own research (DYOR) and consult a qualified financial advisor before making any decision.
Article produced with the assistance of artificial intelligence and reviewed by the editorial team.
